Network Configuration Change Analytics - rConfig V8 Pulse
Change Pulse: Real-Time Configuration Change Visibility
Section titled “Change Pulse: Real-Time Configuration Change Visibility”Change Pulse provides comprehensive visibility into all configuration and state changes across your network infrastructure. By analyzing configuration diffs and device state modifications captured during backup operations, Change Pulse surfaces change patterns, tracks review status, and maintains complete audit trails for compliance and operational awareness.
Understanding Change Pulse
Section titled “Understanding Change Pulse”What Change Pulse Tracks
Section titled “What Change Pulse Tracks”Change Pulse monitors two categories of device modifications:
Configuration Changes: Modifications to device running or startup configurations detected through configuration backup diffs:
- CLI command executions altering device config
- Configuration file uploads or replacements
- SNMP-based configuration modifications
- API-driven configuration updates
- Any change resulting in different configuration content between backups
State Changes: Device operational state modifications captured through state monitoring commands:
- Interface status changes (up/down)
- Routing table modifications
- ARP/MAC table updates
- VPN tunnel state changes
- High-availability status transitions
- Environmental sensor readings
- License or feature activation changes
Both change types are tracked, analyzed, and presented in the unified Change Pulse interface, providing complete visibility into device evolution over time.
How Change Detection Works
Section titled “How Change Detection Works”Change Discovery Process:
-
Backup Execution: rConfig performs scheduled or manual device backup, retrieving configuration and optionally executing state monitoring commands
-
Diff Generation: System compares current backup content with previous version, identifying added, removed, or modified lines
-
Change Classification: Diff analysis determines:
- Change type (configuration vs state)
- Change magnitude (lines affected)
- Affected configuration sections
- Change severity (based on configurable rules)
-
Change Recording: Detected change logged in Change Pulse database with:
- Timestamp of change detection
- Device identification
- Command/config section affected
- Complete diff details
- Initial severity assessment
-
Dashboard Update: Change metrics and history table refresh with new change record, available for review and analysis
Detection Timing: Changes are detected during backup operations. More frequent backups provide near real-time change visibility; less frequent backups result in delayed detection.
Change Pulse Dashboard
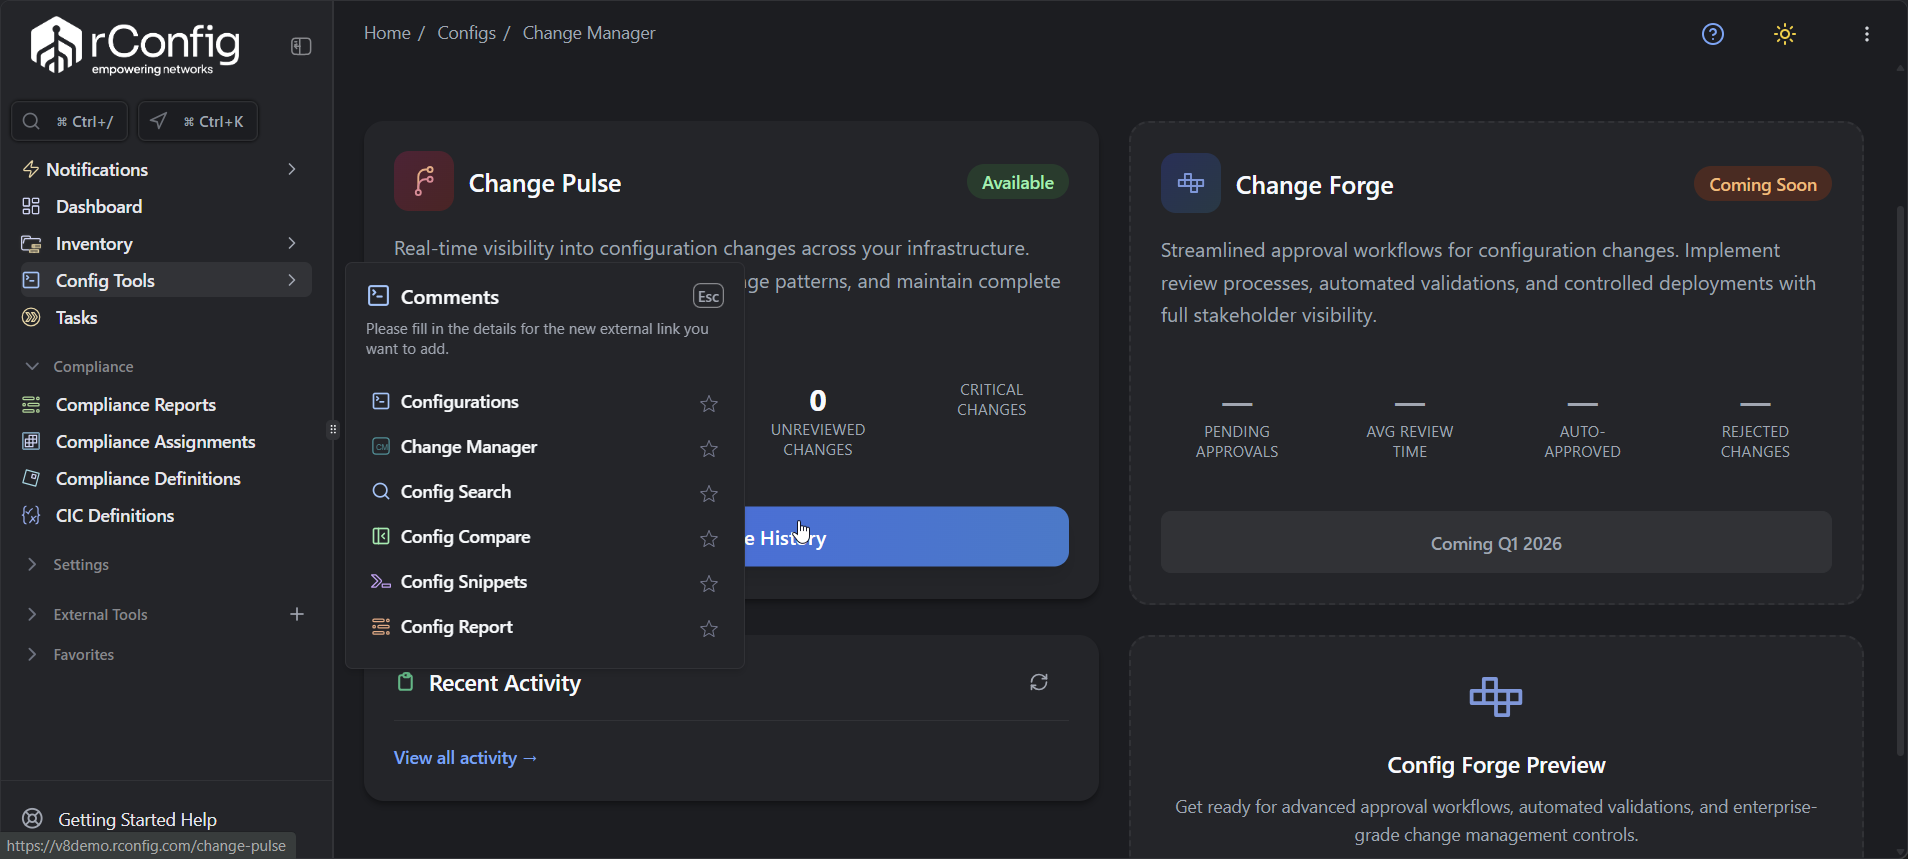
Section titled “Change Pulse Dashboard”Accessing Change Pulse
Section titled “Accessing Change Pulse”Navigate to Change Pulse via the main menu:
Navigation Path: Config Tools → Change Manager → Change Pulse
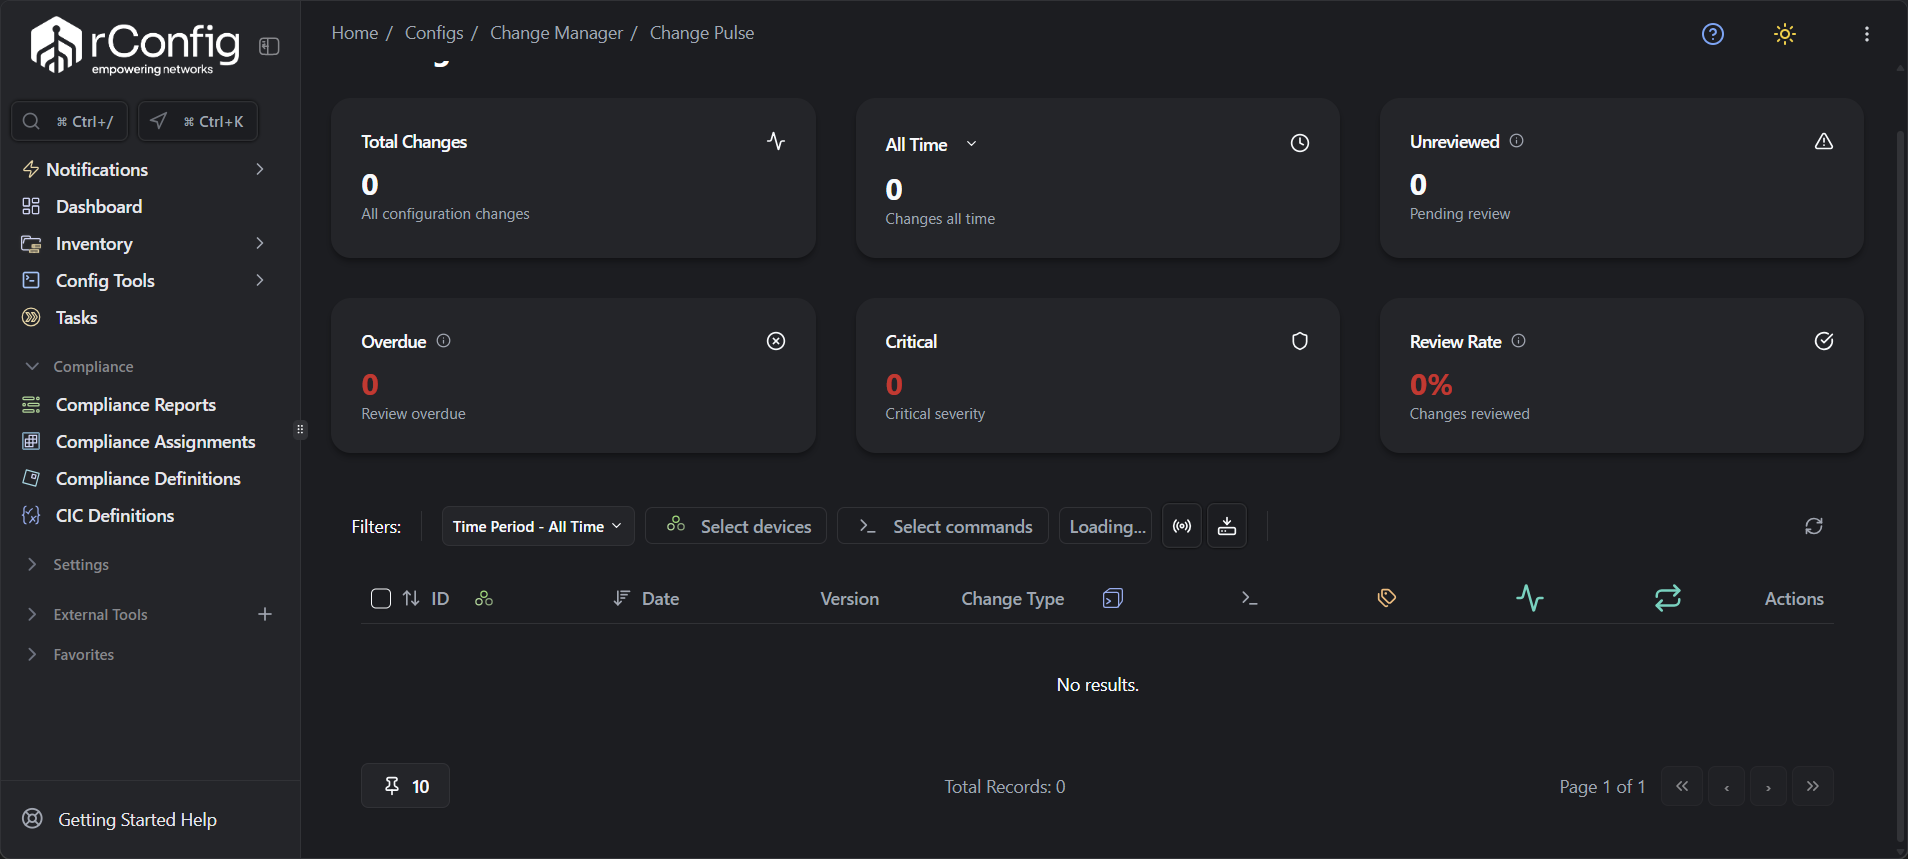
Dashboard Metrics
Section titled “Dashboard Metrics”The Change Pulse dashboard displays six key metrics providing at-a-glance change visibility:
Total Changes
Section titled “Total Changes”Metric: Count of all configuration and state changes within selected time period (default: All Time)
What It Shows: Overall change volume across entire infrastructure, indicating level of network activity and modification frequency.
Use Cases:
- Baseline establishment (what’s “normal” change volume for your environment)
- Trend analysis (is change rate increasing or decreasing over time)
- Capacity planning (are change volumes approaching review capacity)
- Anomaly detection (sudden spikes indicating incidents or unauthorized activity)
Interpretation:
- Low values: Stable environment with infrequent changes
- Moderate values: Active management with regular planned modifications
- High values: Rapidly evolving infrastructure or potential instability
- Sudden increases: Investigation warranted for unexpected change sources
All Time Changes
Section titled “All Time Changes”Metric: Total configuration and state changes since Change Pulse activation, regardless of selected time filter
What It Shows: Historical change volume providing long-term perspective on infrastructure evolution.
Use Cases:
- Historical trend analysis across months or years
- Compliance reporting (total changes during audit period)
- Change management maturity assessment
- Comparison between time periods (this month vs same month last year)
Interpretation: Cumulative metric demonstrating total change activity. Compare with Total Changes (filtered) to understand how current period relates to historical averages.
Unreviewed Changes
Section titled “Unreviewed Changes”Metric: Count of changes not yet marked as reviewed by administrators
What It Shows: Review backlog requiring administrator attention to maintain change visibility and compliance.
Use Cases:
- Daily review queue (what needs attention today)
- Team workload management (distribute review responsibilities)
- Compliance monitoring (ensure timely review per policy)
- Unauthorized change detection (unreviewed changes may be unapproved)
Interpretation:
- Zero: All changes reviewed, full visibility maintained
- Low values: Review process keeping pace with change rate
- High values: Review backlog accumulating, investigation needed
- Increasing trend: Review capacity insufficient for change volume
Overdue Changes
Section titled “Overdue Changes”Metric: Changes exceeding configured review deadline without being reviewed
What It Shows: High-priority review items requiring immediate attention based on organizational SLAs or compliance requirements.
Use Cases:
- SLA compliance monitoring (review within X hours/days)
- Escalation triggers (overdue changes alert management)
- Resource allocation (overdue backlog indicates understaffing)
- Policy enforcement (ensure review timeliness per regulations)
Interpretation:
- Zero: Review SLAs being met, compliance maintained
- Any value: Immediate action needed to address overdue reviews
- Increasing trend: Review process breakdown, escalation required
Configuration: Overdue threshold configured in Change Pulse settings (e.g., “Changes unreviewed after 48 hours marked overdue”).
Critical Changes
Section titled “Critical Changes”Metric: Changes flagged as critical severity based on automated or manual classification
What It Shows: High-impact modifications requiring priority review and potentially immediate action.
Use Cases:
- Security monitoring (critical changes may indicate security events)
- Incident correlation (critical changes near outage times investigated first)
- Priority review (critical changes reviewed before routine modifications)
- Executive reporting (critical change volume for leadership visibility)
Interpretation:
- Low values: Normal operations, few high-impact changes
- High values: Significant infrastructure modifications or potential issues
- Unexpected critical changes: Immediate investigation required
Critical Classification:
- Security-related configs (ACLs, authentication, encryption)
- Routing protocol changes
- High-availability modifications
- User-defined critical patterns
- Manual critical flagging by administrators
Review Rate
Section titled “Review Rate”Metric: Percentage of changes reviewed (reviewed changes / total changes × 100)
What It Shows: Review process effectiveness and change visibility maturity.
Use Cases:
- Process health monitoring (are we keeping up with reviews)
- Goal tracking (target 95%+ review rate for compliance)
- Trend analysis (review rate improving or declining over time)
- Resource planning (declining rate indicates need for more reviewers)
Interpretation:
- 95-100%: Excellent review coverage, strong change visibility
- 80-94%: Good coverage, minor gaps acceptable for most environments
- 60-79%: Concerning gaps, review process improvements needed
- Below 60%: Poor visibility, significant compliance risk
Best Practice: Establish organizational review rate targets (e.g., “Maintain 90% review rate within 24 hours of change detection”) and monitor trends to ensure goals are met.
Filtering and Search
Section titled “Filtering and Search”Change Pulse provides powerful filtering capabilities to focus on relevant changes and support targeted analysis.
Filter Options
Section titled “Filter Options”Time Period Filter
Section titled “Time Period Filter”Options:
- All Time: Display all changes since Change Pulse activation (affects Total Changes metric)
- Today: Changes detected today (00:00 to current time)
- Yesterday: Changes detected previous calendar day
- This Week: Changes within current week (Monday-Sunday)
- Last Week: Changes within previous calendar week
- This Month: Changes within current calendar month
- Last Month: Changes within previous calendar month
- This Year: Changes within current calendar year
- Custom Range: User-defined start and end dates
Use Cases:
- Daily Review: Filter to “Today” or “Yesterday” for daily review workflow
- Weekly Reports: “This Week” for operational team meetings
- Monthly Analysis: “This Month” for trend analysis and reporting
- Incident Investigation: Custom range around incident timeframe
- Compliance Audits: Custom range matching audit period
Interaction with Metrics: Time Period filter updates Total Changes and Review Rate metrics to reflect selected timeframe. All Time Changes and Unreviewed/Overdue/Critical counts remain global (all-time values).
Device Filter
Section titled “Device Filter”Functionality: Select one or more devices to display changes only for selected infrastructure.
Selection Methods:
- Individual Device: Select specific devices by name
- Device Groups: Select all devices in a group (if group filtering available)
- Search: Type device name to quickly locate in large inventories
Use Cases:
- Device-Specific Review: Investigate changes on problematic device
- Device Group Analysis: Review all changes to datacenter core switches
- Comparison: Compare change frequency between similar devices
- Scoped Audits: Compliance review for specific device categories
Example Workflow: “Show me all changes to Production-Core-01 in the last month” → Device Filter: Production-Core-01, Time Period: This Month
Command Filter
Section titled “Command Filter”Functionality: Display changes detected in specific configuration sections or state monitoring commands.
Filter Behavior:
- Configuration Commands: Changes detected in running-config, startup-config, or specific config sections
- State Commands: Changes in show interface, show ip route, show mac-address-table outputs
- Custom Commands: User-defined monitoring commands added to device categories
Use Cases:
- Security Focus: Filter to ACL or security-related commands
- Routing Analysis: Show only routing table changes
- Interface Monitoring: Display interface state changes only
- Targeted Compliance: Review changes in specific regulated config sections
Example Workflow: “Show all ACL changes this month” → Command Filter: access-list/ACL commands, Time Period: This Month
Combined Filtering
Section titled “Combined Filtering”Filters can be combined for precise change queries:
Example 1: Security Audit
- Time Period: Last Month
- Device Filter: All Firewall Devices
- Command Filter: Security-related configs
- Result: All security configuration changes on firewalls during audit period
Example 2: Incident Investigation
- Time Period: Custom (incident timeframe ± 4 hours)
- Device Filter: Devices experiencing incident
- Command Filter: All commands
- Result: All changes on affected devices near incident time
Example 3: Operational Review
- Time Period: This Week
- Device Filter: All Devices
- Command Filter: Routing protocols
- Result: Weekly routing changes across infrastructure for team review
Change History Table
Section titled “Change History Table”Table Columns
Section titled “Table Columns”The change history table displays all changes matching current filter criteria:
ID: Unique identifier for each change record
- Sequential numbering for easy reference
- Used in investigations and audit documentation
- Clickable to access detailed change view
Date: Timestamp when change was detected
- Format: YYYY-MM-DD HH:MM:SS (server local time)
- Sortable for chronological or reverse-chronological viewing
- Indicates change detection time, not necessarily when change was made to device
Version: Configuration or state version number
- Incremental versioning (version 1, 2, 3, etc.)
- Links to specific configuration/state snapshot
- Enables comparison between any two versions
Change Type: Classification of change
- Config: Configuration change (running-config, startup-config modifications)
- State: Device state change (interface status, routing table, etc.)
- Future: Additional granular types (Security, Routing, Interface, etc.)
Actions: Available operations for each change record
- View Details: Open detailed diff and change information
- Review/Mark Reviewed: Mark change as reviewed (updates Unreviewed counter)
- Flag Critical: Manually mark change as critical severity
- Add Notes: Attach administrative notes to change record
- Export: Download change details for external analysis
Sorting and Pagination
Section titled “Sorting and Pagination”Sorting: Click any column header to sort table by that column
- ID: Numerical order
- Date: Chronological or reverse-chronological
- Version: Version number sequence
- Change Type: Alphabetical (Config before State)
Pagination: Navigate through large change sets
- Adjustable page size (10, 25, 50, 100 records per page)
- Page navigation (first, previous, next, last)
- Total record count displayed
Performance: For environments with thousands of changes, use filters to reduce result set before sorting or exporting.
Reviewing Changes
Section titled “Reviewing Changes”Review Workflow
Section titled “Review Workflow”Standard Review Process:
-
Access Change Pulse: Navigate to Config Tools → Change Manager → Change Pulse
-
Apply Filters: Set time period and device/command filters to focus review scope
- Example: Time Period = Today, Device Filter = All
-
Identify Unreviewed Changes: Note “Unreviewed” metric count
-
Review Individual Changes:
- Click “View Details” action for first unreviewed change
- Examine diff showing added/removed/modified lines
- Review change context (device, timestamp, command)
- Determine if change is:
- Expected/Authorized: Planned change or normal operation
- Unexpected/Unauthorized: Requires investigation
- Critical: High-impact change needing escalation
-
Mark as Reviewed: Click “Mark Reviewed” button to acknowledge review
- Unreviewed counter decrements
- Review timestamp and reviewer recorded
- Change excluded from future unreviewed queries
-
Add Notes (if needed):
- Document investigation findings
- Note approval reference (ticket number, change request)
- Record follow-up actions required
-
Flag Critical (if needed):
- Mark high-impact changes for visibility
- Critical counter increments
- Change appears in critical change reports
-
Repeat: Continue reviewing remaining unreviewed changes
-
Complete Review: When Unreviewed count reaches zero, review session complete
Detailed Change View
Section titled “Detailed Change View”Clicking “View Details” opens comprehensive change information:
Diff Display:
- Added Lines: Highlighted in green (new configuration/state)
- Removed Lines: Highlighted in red (deleted configuration/state)
- Modified Lines: Shown as removal + addition (old value removed, new value added)
- Context Lines: Unchanged lines surrounding changes for context
Change Metadata:
- Device Information: Device name, IP, type, location
- Timestamp: Exact detection time (down to seconds)
- Change Magnitude: Lines added/removed/modified count
- Version Info: Previous version → current version
- Command/Section: Which command or config section changed
- Change Type: Config or State classification
- Severity: Current severity level (Normal, Critical)
- Review Status: Reviewed/Unreviewed, reviewer name, review timestamp
Available Actions:
- Mark Reviewed/Unreviewed: Toggle review status
- Flag Critical/Unflag: Toggle critical severity
- Add/Edit Notes: Administrative notes attachment
- View Full Config: Access complete configuration at this version
- Compare Versions: Select two versions for side-by-side comparison
- Export Change: Download diff as text or PDF
- View Device Page: Navigate to device details
Bulk Review Operations
Section titled “Bulk Review Operations”For efficient review of multiple similar changes:
Bulk Actions (future enhancement):
- Select multiple changes via checkboxes
- Apply actions to all selected:
- Mark all as reviewed
- Flag all as critical
- Add same note to multiple changes
- Export selected changes
Current Workaround: Review changes individually using rapid workflow:
- View Details → Review diff → Mark Reviewed → Close
- Next change → Repeat
Change Analysis and Reporting
Section titled “Change Analysis and Reporting”Identifying Change Patterns
Section titled “Identifying Change Patterns”High Change Frequency Devices:
- Apply Device Filter to each device individually
- Note Total Changes count for each
- Devices with significantly higher counts warrant investigation:
- Are changes planned (development, testing)?
- Are changes due to instability (flapping, configuration drift)?
- Are changes unauthorized (security concern)?
Change Clustering:
- Filter by narrow time ranges (e.g., 1-hour windows)
- High change counts in short windows indicate:
- Coordinated maintenance (multiple related changes)
- Automation execution (script-driven changes)
- Potential change storm (need for rate limiting)
Unusual Change Timing:
- Filter to non-maintenance windows (e.g., weekends, off-hours)
- Changes during unauthorized times may indicate:
- Emergency changes (verify justification)
- Unauthorized access (security investigation)
- Automated processes (verify expected behavior)
Change Type Distribution:
- Compare Config vs State change counts
- High state change volumes may indicate:
- Unstable environment (interfaces flapping, routes changing)
- Dynamic infrastructure (legitimate state flux)
- Monitoring command frequency (adjust if generating noise)
Audit Trail Generation
Section titled “Audit Trail Generation”Compliance Reporting:
-
Define Audit Period: Set Time Period filter to compliance timeframe (e.g., Last Month)
-
Apply Scope Filters: Select devices/commands subject to audit requirements
-
Export Change Data: Use export functionality to generate compliance report
-
Review Coverage: Verify Review Rate metric meets compliance threshold (e.g., 95%+)
-
Document Unreviewed: Explain any unreviewed changes in compliance report
-
Include Critical Changes: Highlight critical changes and resolution actions
Audit Report Contents:
- Total change count during audit period
- Change breakdown by device, type, severity
- Review rate and overdue change count
- Critical change details and responses
- Unauthorized change investigations (if any)
Investigation Support
Section titled “Investigation Support”Incident Correlation:
When network incidents occur, Change Pulse provides immediate change context:
-
Identify Incident Timeframe: Note exact incident start time
-
Set Time Filter: Custom range = incident start minus 4 hours to incident start plus 1 hour
-
Filter to Affected Devices: Select devices experiencing issues
-
Review All Changes: Examine every change in timeframe for potential cause
-
Prioritize Critical: Review critical changes first (most likely incident triggers)
-
Document Correlation: Note any changes coinciding with incident onset
-
Root Cause Determination: Assess if identified change caused incident
Example Investigation:
- Incident: Core switch outage at 14:32
- Time Filter: 10:30-15:30 (4 hours before to 1 hour after)
- Device Filter: Core-Switch-01
- Result: Critical routing protocol change at 14:28 identified as root cause
Roadmap and Future Enhancements
Section titled “Roadmap and Future Enhancements”Automatic Severity Classification
Section titled “Automatic Severity Classification”Planned Capabilities:
Content-Based Severity: Algorithm analyzes configuration changes to detect high-impact modifications:
- Security changes (ACL modifications, authentication changes)
- High-availability changes (HSRP, VRRP, clustering)
- Core routing changes (BGP, OSPF backbone modifications)
- Critical service changes (DNS, DHCP, NAT rules)
Context-Based Severity: System considers change context beyond content:
- Change magnitude (large configuration blocks modified)
- Device criticality (core vs edge, production vs lab)
- Change timing (production hours vs maintenance window)
- Historical patterns (unusual changes flagged higher severity)
Machine Learning: Over time, system learns from manual severity adjustments:
- Administrators manually flag/unflag critical changes
- ML model trains on historical severity decisions
- Future similar changes automatically classified accurately
- Continuous improvement as more data accumulates
Severity Levels:
- Critical: Immediate review required, high incident risk
- High: Priority review, moderate impact potential
- Medium: Standard review, routine operational changes
- Low: Informational, minimal impact (state changes, non-critical configs)
Change Forge Integration
Section titled “Change Forge Integration”Automatic Correlation:
When Change Forge launches, Change Pulse will automatically link detected changes to approval records:
-
Change Detected: Pulse identifies configuration modification
-
Approval Lookup: System searches Change Forge for matching approval:
- Same device
- Similar timeframe (change within approved deployment window)
- Matching change description or affected config sections
-
Correlation Established: If matching approval found:
- Change marked “Approved”
- Approval reference added to change record
- Change linked to approval audit trail
- Review may be auto-completed (change expected per approval)
-
Unapproved Change Alert: If no matching approval:
- Change flagged “Unapproved”
- Alert generated for investigation
- Severity automatically elevated
- Requires manual review and justification
Audit Trail Enhancement:
- Complete change lifecycle: Request → Approval → Detection → Verification
- Compliance reporting improved (% changes with approvals)
- Unauthorized change detection automated
- Change governance measurable (approved vs unapproved ratio)
Manual Review Enhancements
Section titled “Manual Review Enhancements”Planned Review Features:
Review Assignment: Distribute review responsibilities across team members
- Assign changes to specific reviewers based on expertise
- Track review workload per team member
- Notification when changes assigned
- Escalation if reviews not completed within SLA
Review Comments and Collaboration:
- Multi-user commenting on changes
- @mention team members for input
- Threaded discussions on change records
- Decision documentation (why change approved/rejected)
Review Templates: Standardized review checklists
- Predefined questions for different change types
- Required fields before review completion
- Consistency across reviewers
- Training tool for new team members
Review Analytics:
- Average review time per reviewer
- Review accuracy (changes requiring re-review)
- Reviewer workload distribution
- Review SLA compliance per team member
Configuration and State Change Differentiation
Section titled “Configuration and State Change Differentiation”Enhanced Change Type Granularity:
Current: Config vs State (2 types)
Future: Detailed classification (10+ types):
- Security Configuration: ACLs, authentication, encryption
- Routing Configuration: BGP, OSPF, static routes
- Interface Configuration: IP addresses, VLANs, port settings
- Service Configuration: DHCP, DNS, NTP, SNMP
- Interface State: Link up/down, speed/duplex changes
- Routing State: Route additions/removals, next-hop changes
- ARP/MAC State: Address table modifications
- Environmental State: Temperature, fan, power supply status
- HA State: Failover events, cluster status changes
- License State: Feature activation, license expiration
Benefits:
- Targeted filtering (show only routing changes)
- Type-specific severity rules (all security changes = critical)
- Specialized review workflows (route changes to network team, security changes to security team)
- Granular reporting (security change volume over time)
Implementation: Change classification engine analyzes diff content and command to determine specific type, enabling granular filtering and type-based automation.
Best Practices
Section titled “Best Practices”Establishing Review Processes
Section titled “Establishing Review Processes”Daily Review Workflow:
- Morning Review: Filter to “Yesterday”, review all changes from previous day
- Triage: Identify critical changes requiring immediate investigation
- Mark Reviewed: Acknowledge all expected changes
- Escalate Unexpected: Flag and investigate unauthorized changes
- Document: Add notes to significant changes for audit trail
Weekly Analysis:
- Trend Review: Filter to “This Week”, analyze Total Changes vs last week
- Device Analysis: Identify high-change devices, investigate causes
- Pattern Detection: Look for change clusters, unusual timing
- Review Rate Check: Ensure meeting organizational review SLA
- Report: Summarize findings for team meeting
Monthly Reporting:
- Compliance Report: Generate audit trail for compliance period
- Metric Summary: Total changes, review rate, critical changes
- Top Changers: Devices with highest change counts
- Investigation Summary: Unauthorized changes and resolutions
- Trend Analysis: Month-over-month change volume comparison
Defining Critical Change Criteria
Section titled “Defining Critical Change Criteria”Organizational Policy: Establish clear criteria for critical change classification:
Security-Related:
- Any ACL or firewall rule modification
- Authentication or authorization changes
- Encryption or VPN configuration changes
- SNMP community string modifications
High-Availability:
- Routing protocol changes on core infrastructure
- Failover or redundancy configuration changes
- Clustering or stack configuration modifications
Service-Critical:
- DNS or DHCP service changes
- Load balancer configuration changes
- Changes to services supporting critical applications
Magnitude-Based:
- Changes affecting >50 configuration lines
- Multiple device changes within short timeframe
- Changes during unauthorized maintenance windows
Document Criteria: Publish critical change policy, train team members, consistently apply during review.
Optimizing Change Detection
Section titled “Optimizing Change Detection”Backup Frequency: Balance change detection timeliness with system load
- High Change Environments: Hourly backups for near real-time detection
- Stable Environments: Daily backups sufficient for routine monitoring
- Critical Devices: More frequent backups than non-critical infrastructure
State Monitoring: Selectively enable state change monitoring
- Enable: For devices where state changes are meaningful (core routing, HA devices)
- Disable: For devices with high state flux generating noise (access switches with frequent interface state changes)
Filter Noise: Adjust monitoring to reduce false positives
- Exclude expected state changes (interfaces expected to flap)
- Filter transient state (ARP entries, temporary routes)
- Focus on persistent, meaningful changes
Troubleshooting
Section titled “Troubleshooting”No Changes Appearing
Section titled “No Changes Appearing”Symptom: Change Pulse shows zero changes despite known device modifications.
Diagnostic Steps:
-
Verify Backups Running: Check that device backups are executing successfully
- Navigate to device page, review backup history
- Confirm recent successful backups
-
Check Diff Generation: Ensure configuration diffs are being created
- View device config history
- Verify multiple versions exist (not just single version)
-
Review Time Filter: Confirm filter not excluding relevant changes
- Set Time Period to “All Time”
- Verify changes appear in unfiltered view
-
Validate Device Filter: Ensure device filter includes affected devices
- Clear all filters
- Re-apply filters individually to isolate issue
Resolution: If backups successful but no changes detected, configurations may be identical between backups (no actual changes occurred) or diff generation may have errors (check logs).
Incorrect Review Counts
Section titled “Incorrect Review Counts”Symptom: Unreviewed or Overdue counts don’t match actual change review status.
Possible Causes:
- Browser cache showing stale data
- Database synchronization delay
- Filter affecting count calculations
Resolution:
- Refresh browser page (F5 or Ctrl+R)
- Clear browser cache and cookies
- Log out and log back in
- If issue persists, contact rConfig support
Performance Issues with Large Change Sets
Section titled “Performance Issues with Large Change Sets”Symptom: Dashboard slow to load with thousands of changes.
Optimization Steps:
-
Use Time Filters: Narrow time period to reduce result set
- Instead of “All Time”, use “This Month” or “This Week”
-
Apply Device Filters: Focus on subset of devices
- Review by device group rather than all devices simultaneously
-
Reduce Page Size: Lower pagination from 100 to 25 or 10 records per page
-
Export for Analysis: For large datasets, export to CSV and analyze externally
-
Archive Old Data: Work with rConfig support to archive very old changes not needed for active review
Related Documentation
Section titled “Related Documentation”- Change Manager Overview - Understanding Change Manager vision and integration
- Change Forge User Guide - Approval workflow documentation (coming Q1 2026)
- Configuration Diffs - How diffs power change detection
- Configuration Backup Implementation - Backup processes enabling change visibility
Quick Reference
Section titled “Quick Reference”Accessing Change Pulse
Section titled “Accessing Change Pulse”Navigation: Config Tools → Change Manager → Change Pulse
Key Metrics
Section titled “Key Metrics”- Total Changes: All changes in selected time period
- All Time Changes: Historical total since activation
- Unreviewed: Changes requiring review
- Overdue: Changes exceeding review SLA
- Critical: High-severity changes
- Review Rate: Percentage of reviewed changes
Filter Options
Section titled “Filter Options”- Time Period: All Time, Today, Yesterday, This Week, Last Week, This Month, Last Month, This Year, Custom Range
- Device Filter: Select specific devices or device groups
- Command Filter: Filter by configuration section or state command
Review Workflow
Section titled “Review Workflow”- Apply filters to focus review scope
- Click “View Details” on unreviewed change
- Examine diff and change context
- Determine if expected/unexpected/critical
- Mark as reviewed
- Add notes if needed
- Flag critical if required
- Repeat for remaining unreviewed changes
Change Types
Section titled “Change Types”- Config: Configuration changes (running-config, startup-config)
- State: Device state changes (interface status, routing, etc.)
Actions Available
Section titled “Actions Available”- View Details: Open detailed diff view
- Mark Reviewed: Acknowledge change review
- Flag Critical: Mark high-severity change
- Add Notes: Attach administrative comments
- Export: Download change details
Summary
Section titled “Summary”Change Pulse provides the visibility foundation for effective configuration change management. By tracking all configuration and state modifications, maintaining review status, and enabling targeted analysis, Change Pulse ensures organizations maintain complete awareness of infrastructure evolution.
Current Capabilities:
- Real-time change detection for configs and state
- Comprehensive filtering (time, device, command)
- Review workflow and status tracking
- Audit trail generation and compliance reporting
- Pattern analysis and incident investigation support
Future Enhancements (Roadmap):
- Automatic severity classification based on content and context
- Change Forge integration for approval correlation
- Enhanced manual review features (assignment, collaboration, templates)
- Granular change type classification (10+ types)
Best Practices:
- Establish daily review workflows to maintain low unreviewed counts
- Define clear critical change criteria organization-wide
- Use filtering strategically for focused analysis
- Generate regular compliance reports from change data
- Leverage change history for incident investigation
Change Pulse transforms configuration backups from simple file storage into actionable intelligence, enabling proactive change management and operational excellence.