Network SNMP Trap Management Dashboard - rConfig V8 UI
SNMP Trap Handler: User Interface and Administration
Section titled “SNMP Trap Handler: User Interface and Administration”The SNMP Trap Handler provides a comprehensive web-based interface for monitoring, filtering, and managing SNMP trap notifications from your network devices. This guide covers all aspects of the trap management interface, from real-time dashboard monitoring to advanced filter configuration and device resolution mapping.
Accessing the SNMP Trap Interface
Section titled “Accessing the SNMP Trap Interface”Navigate to the SNMP Trap Handler interface through the rConfig main navigation:
Network Services → SNMP Traps
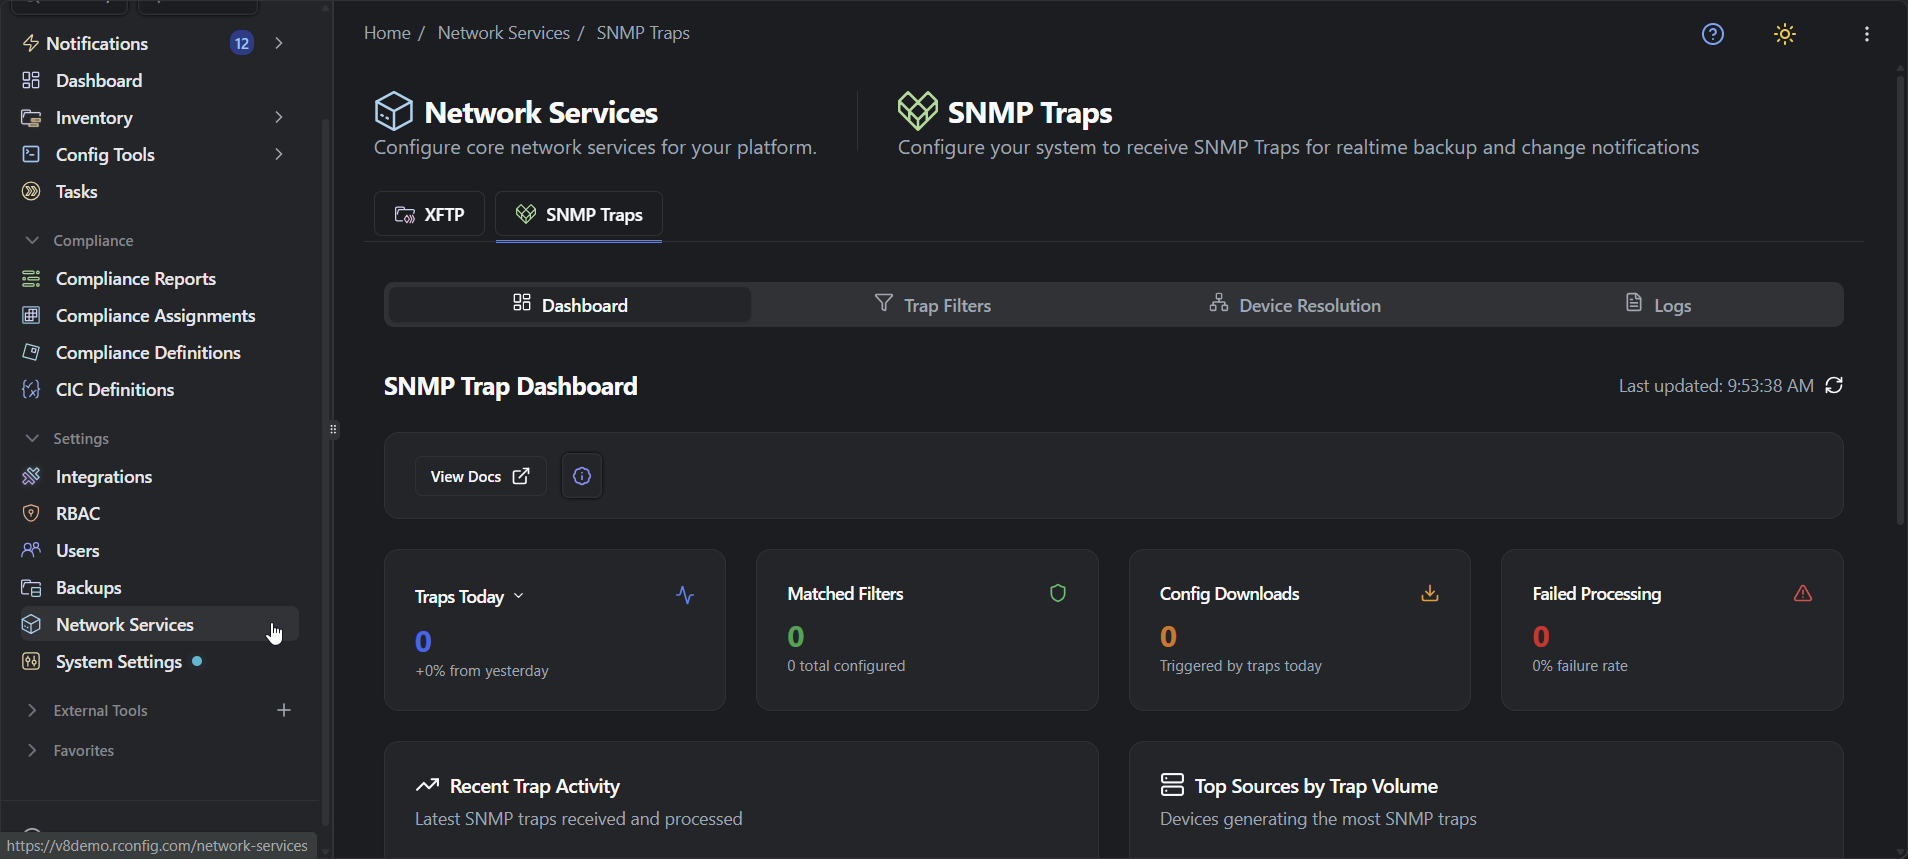
The interface is organized into four primary sections accessible via tabs:
- Dashboard: Real-time monitoring and trap activity overview
- Trap Filters: Configure rules to match and process specific traps
- Device Resolution: Map trap source IPs to rConfig device records
- Logs: Historical trap records and processing details
Dashboard: Real-Time Monitoring
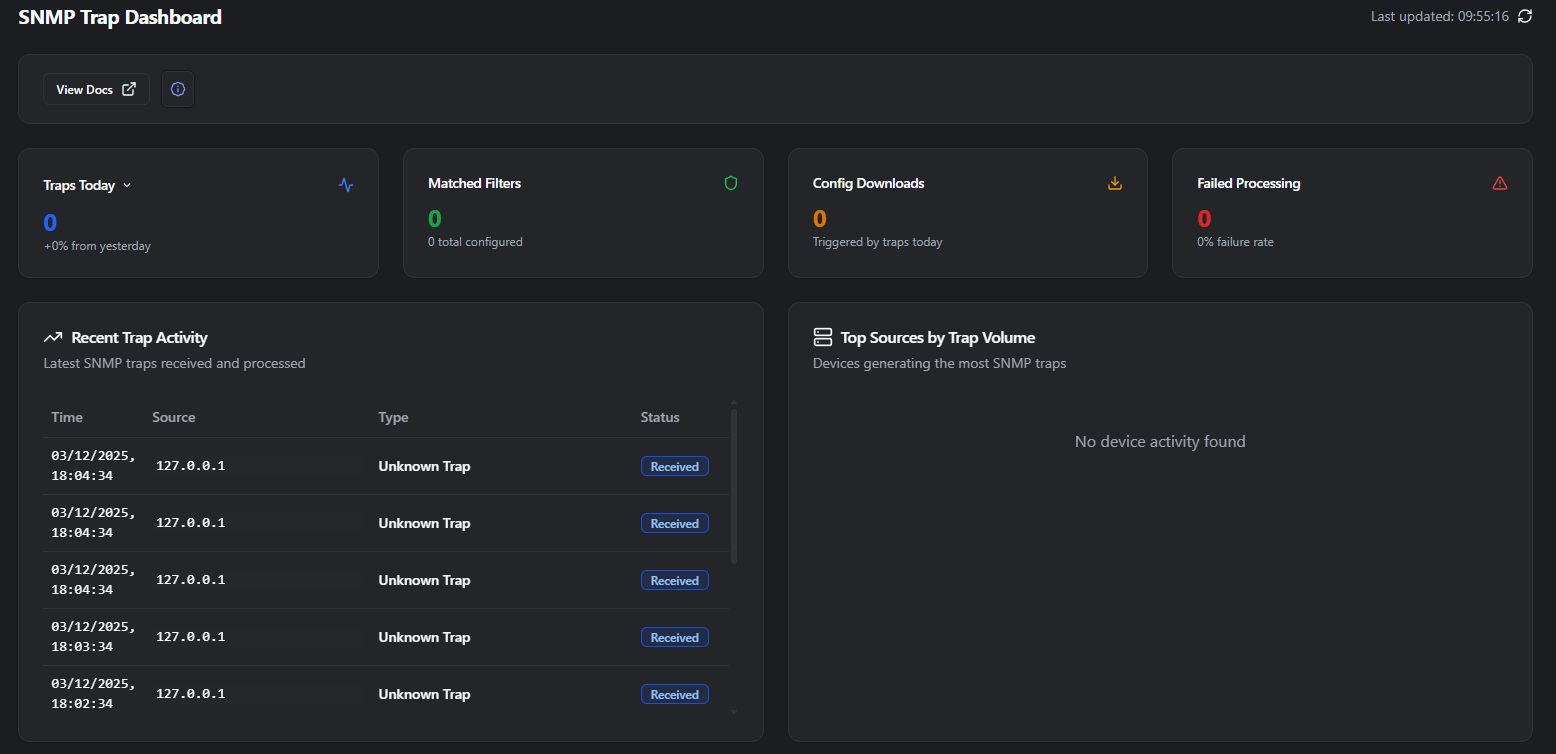
Section titled “Dashboard: Real-Time Monitoring”The SNMP Trap Dashboard provides at-a-glance visibility into trap reception, processing status, and system health.
Service Status Indicator
Section titled “Service Status Indicator”Service Status Panel: Displays current operational state of the SNMP Trap Handler service:
- Online (Green): Service running and receiving traps
- Port 162 Inactive (Yellow): Service running but not bound to standard port
- Offline (Red): Service not running or unreachable
Last Update Timestamp: Shows when the dashboard last refreshed data from the trap handler, confirming real-time communication between the UI and the background service.
View Docs Link: Quick access to trap handler documentation and configuration guides.
Key Performance Metrics
Section titled “Key Performance Metrics”The dashboard displays four primary metrics providing operational insights:
Traps Today:
- Total number of traps received since midnight
- Percentage change compared to previous day
- Positive change indicates increased trap volume (potential issues or expanded monitoring)
- Negative change suggests reduced activity (potential device connectivity issues)
Matched Filters:
- Number of traps that matched configured filter rules today
- Total number of filter rules currently configured
- Low match rate may indicate filters need refinement or new filters required
Config Downloads:
- Number of configuration backups triggered by trap-based automation
- Shows effectiveness of trap-driven backup workflows
- Useful for tracking event-driven configuration captures
Failed Processing:
- Count of traps that encountered processing errors
- Failure rate percentage of total traps received
- High failure rates require investigation via Logs section
Recent Trap Activity
Section titled “Recent Trap Activity”Real-time table displaying the latest SNMP traps as they arrive:
| Column | Description |
|---|---|
| Time | Timestamp when trap was received (timezone: server local time) |
| Source | IP address of device that sent the trap |
| Type | Trap classification (if matched to filter) or “Unknown Trap” |
| Status | Processing status: Received, Matched, Processed, Failed |
Status Indicators:
- Received: Trap successfully received by handler
- Matched: Trap matched one or more configured filters
- Processed: Associated actions executed successfully
- Failed: Error occurred during trap processing
Unknown Trap Classification: Traps showing “Unknown Trap” have not matched any configured filters. This is normal for devices sending traps without filter rules configured, but frequent unknown traps from important devices suggest filters should be created.
Top Sources by Trap Volume
Section titled “Top Sources by Trap Volume”Visual chart displaying devices generating the highest trap volumes over the selected time period. Useful for identifying:
- Most active devices requiring filter configuration
- Potential trap storms from malfunctioning equipment
- Devices needing trap rate limiting or source filtering
No Device Activity: Displayed when no traps have been received or device resolution has not mapped trap sources to rConfig devices.
Filter Performance Analysis
Section titled “Filter Performance Analysis”Filter Match Statistics:
- Matched Traps: Count of traps successfully matched by filters
- Unmatched Traps: Count of traps with no filter match
- Match Rate: Percentage of total traps matching filters
Optimization Insight: Low match rates indicate opportunity to expand filter coverage. High match rates confirm effective filter configuration for your environment.
Processing Performance
Section titled “Processing Performance”Processing Metrics:
- Avg Processing Time: Mean time to process each trap (milliseconds)
- Actions Executed: Total number of automated actions triggered by matched traps
- Device Summary: Statistics on device resolution effectiveness
Performance Expectations:
- Processing times under 50ms: Excellent performance
- Processing times 50-200ms: Normal performance
- Processing times over 200ms: May indicate database optimization needed or complex filter actions
Trap Filters: Intelligent Trap Processing
Section titled “Trap Filters: Intelligent Trap Processing”Trap filters define rules that match incoming SNMP traps and trigger automated actions. Filters enable intelligent trap handling, transforming raw notifications into actionable workflows.
Understanding Trap Filters
Section titled “Understanding Trap Filters”What Filters Do:
Trap filters examine incoming SNMP traps against defined criteria (OID, vendor, source) and execute specified actions when matches occur. This automation enables:
- Selective Configuration Backups: Capture device config when “configuration changed” traps received
- Alert Routing: Send notifications for critical traps while ignoring routine events
- Event Correlation: Link trap events with configuration changes for audit trails
- Action Throttling: Prevent action overload using cooldown periods
Filter Matching Process:
- Trap received from network device
- Handler extracts trap OID and varbinds
- Compares trap against all enabled filters
- First matching filter triggers configured actions
- Cooldown period prevents repeat action execution
Filter Management Table
Section titled “Filter Management Table”The Filters table displays all configured trap filters with key attributes:
| Column | Description |
|---|---|
| Name | Descriptive filter identifier |
| Description | Detailed purpose and use case |
| Trap OID | Object Identifier that filter matches |
| Vendor | Device manufacturer/platform |
| Status | Enabled/Disabled state |
| Actions | Edit or delete filter |
Bulk Operations: Select multiple filters to enable, disable, or delete in a single operation.
Creating Trap Filters
Section titled “Creating Trap Filters”Click Add to launch the trap filter creation form:

Basic Filter Configuration
Section titled “Basic Filter Configuration”Trap Type (Optional):
- Select from pre-configured trap examples imported from common vendor MIBs
- Auto-populates Name, Description, OID, and Vendor fields
- Useful for standard traps (linkDown, configChanged, authenticationFailure)
- Leave blank for custom or uncommon traps
Name (Required):
- Descriptive identifier for the filter
- Best practice: Include vendor, trap purpose, and action
- Example: “Cisco Config Change - Auto Backup”
Description:
- Detailed explanation of filter purpose and expected behavior
- Document business rationale and troubleshooting notes
- Example: “Triggers immediate configuration backup when Cisco device sends ciscoConfigManEvent trap. Used for audit compliance on production core routers.”
Trap OID (Required):
- Complete SNMP Object Identifier for the trap
- Must match trap OID from device exactly
- Example:
1.3.6.1.4.1.9.9.43.2.0.1(Cisco config change) - Use MIB browsers or vendor documentation to identify correct OIDs
Vendor (Required):
- Select device manufacturer from dropdown
- Used for filter organization and reporting
- Helps identify vendor-specific trap patterns
Status:
- Enabled: Filter actively matches traps and executes actions
- Disabled: Filter stored but inactive (useful for testing or temporary suspension)
Advanced Filter Settings
Section titled “Advanced Filter Settings”Cooldown Override:
- Minimum time period (seconds) before filter can trigger again for the same device
- Prevents action overload during trap storms or rapid repeated events
- Default: 300 seconds (5 minutes)
- Lower values: More responsive but higher action frequency
- Higher values: Reduces action load but may miss legitimate events
Cooldown Use Cases:
- Configuration backup filters: 300-600 seconds (avoid backup storms)
- Critical alerts: 60-120 seconds (ensure timely notification)
- Routine monitoring: 600-1800 seconds (reduce notification noise)
Action Configuration
Section titled “Action Configuration”Available Actions:
Select one or more actions to execute when the filter matches a trap:
- Download Configuration: Trigger immediate device backup
- Send Email Notification: Alert specified recipients
- Execute Webhook: POST trap data to external systems
- Create Incident Ticket: Integrate with ticketing systems
- Run Custom Script: Execute user-defined automation
Action Sequencing: Actions execute in the order displayed. Critical actions (backups, tickets) should precede notifications to ensure data capture before alerting.
Action Configuration Example:
Filter: "Juniper Config Commit Notification"Actions: 1. Download Configuration (Primary device) 2. Send Email Notification ([email protected]) 3. Execute Webhook (https://monitoring.company.com/api/events)Video Tutorial: Creating Trap Filters
Section titled “Video Tutorial: Creating Trap Filters”Step-by-step demonstration of creating a trap filter from selection to action configuration
Filter Best Practices
Section titled “Filter Best Practices”Start with Common Traps: Configure filters for high-value traps first:
- Configuration change notifications
- Authentication failures
- Critical hardware alerts
- Link state changes on critical interfaces
Test Before Enabling: Create filters in disabled state, verify OID accuracy in logs, then enable after confirming matches.
Document Filter Logic: Use description field to explain:
- Why filter was created
- Expected trap frequency
- What actions accomplish
- Any special considerations
Monitor Match Rates: Review dashboard filter performance regularly. Filters with zero matches may have incorrect OIDs or be obsolete.
Use Appropriate Cooldowns: Balance responsiveness with action overload. Start conservative (5-10 minutes), adjust based on actual trap patterns.
Device Resolution: Mapping Trap Sources
Section titled “Device Resolution: Mapping Trap Sources”Device Resolution maps trap source IP addresses to rConfig device records, enabling trap correlation with device configurations and automated workflows.
Why Device Resolution Matters
Section titled “Why Device Resolution Matters”The Challenge: Network devices often send traps from management interfaces, loopback addresses, or secondary IPs that don’t match the IP address configured in rConfig for device management. Without resolution mapping, rConfig cannot associate traps with device records.
The Solution: Device IP mappings explicitly link trap source IPs to rConfig devices, enabling:
- Accurate trap-to-device correlation in logs and reports
- Device-specific filter actions (backup correct device when trap received)
- Historical analysis of trap patterns per device
- Integration with device-specific configuration workflows
Example Scenario:
- Device “core-router-01” in rConfig:
10.1.1.1(management IP) - Traps sent from:
192.168.100.1(loopback interface) - Without mapping: Traps show “No device” in logs
- With mapping: Traps correctly associated with core-router-01
Device Resolution Table
Section titled “Device Resolution Table”Displays all configured IP mappings:
| Column | Description |
|---|---|
| Device | rConfig device name |
| IP Address | Trap source IP to map |
| Status | Enabled/Disabled |
| Notes | Mapping documentation |
| Actions | Edit or delete mapping |
Creating Device Mappings
Section titled “Creating Device Mappings”Click Add to create a new device IP mapping:
Device (Required):
- Select target device from rConfig device inventory
- Use search/filter to locate device by name or IP
- Device must exist in rConfig before creating mapping
IP Address (Required):
- Enter trap source IP address exactly as seen in trap logs
- Format: Standard IPv4 (e.g.,
192.168.100.1) or IPv6 - This is the IP address from which the device sends traps
Status:
- Enabled: Mapping actively resolves trap sources
- Disabled: Mapping stored but not used (testing or temporary)
Notes:
- Document why mapping is needed
- Record interface or source information
- Example: “Loopback0 interface used for all SNMP operations”
Video Tutorial: Device Resolution
Section titled “Video Tutorial: Device Resolution”Demonstration of identifying unmapped trap sources and creating device resolution mappings
Mapping Best Practices
Section titled “Mapping Best Practices”Identify Unmapped Sources: Review trap logs for “No device” entries, note source IPs, create mappings for devices sending valuable traps.
Document Interface Context: Use Notes field to record which physical/logical interface sends traps. Aids troubleshooting when trap sources change.
Verify After Creation: After adding mapping, confirm next trap from that IP correctly associates with device in trap logs.
Handle Multi-Interface Devices: Devices with multiple management IPs sending traps may require multiple mappings (one per source IP).
Update During Network Changes: When devices are readdressed or management interfaces change, update or create new mappings to maintain correlation.
Logs: Trap History and Analysis
Section titled “Logs: Trap History and Analysis”The Logs section provides searchable, filterable access to all received SNMP traps with detailed processing information.
Log Table Columns
Section titled “Log Table Columns”| Column | Description |
|---|---|
| ID | Unique trap record identifier |
| Source | IP address that sent the trap |
| Trap OID | Object Identifier of received trap (N/A if not parsed) |
| Event Type | Trap classification from filter or parsed MIB |
| Device | Mapped device name or “No device” if unmapped |
| Filter Match | Name of matched filter or “No match” |
| Status | Processing status (received, processed, failed) |
| Created | Timestamp when trap was received |
| Actions | View details, raw trap data, or delete |
Understanding Log Entries
Section titled “Understanding Log Entries”Example Log Entry:
ID: 1009Source: 127.0.0.1Trap OID: N/AEvent Type: Memory Usage CheckDevice: No deviceFilter Match: No matchStatus: receivedCreated: 12/10/2025, 20:15:13Analysis: This trap was received from localhost (likely test trap), did not match any filter, and has no device mapping. The event type suggests it’s a monitoring trap that may not require action.
Searching and Filtering Logs
Section titled “Searching and Filtering Logs”Search Capabilities:
- Filter by source IP address
- Search by device name
- Filter by event type or trap OID
- Date range selection
- Status filtering (received, processed, failed)
Common Search Scenarios:
Find all traps from specific device:
- Enter device name in search
- Review trap frequency and types
- Identify candidates for filter creation
Identify failed processing:
- Filter status: “failed”
- Review error details in trap details
- Troubleshoot filter actions or device mappings
Analyze trap patterns:
- Select date range
- Export filtered results
- Analyze in spreadsheet for trends
Trap Detail View
Section titled “Trap Detail View”Click the actions menu (⋯) and select “View Details” to see complete trap information:
Detail View Includes:
- Complete varbind list (all OID-value pairs in trap)
- Raw trap PDU data
- Processing timeline (received, matched, actions executed)
- Error messages if processing failed
- Associated device configuration snapshot (if backup action triggered)
Use Cases for Detail View:
- Troubleshooting filter matching issues
- Verifying trap content for filter creation
- Investigating processing failures
- Auditing automated actions executed
Log Retention and Management
Section titled “Log Retention and Management”Automatic Retention: Trap logs are retained according to system configuration (default: 90 days). Older logs are automatically purged to manage database size.
Manual Log Management:
- Export logs to CSV for external analysis
- Delete specific trap records manually
- Bulk delete using filters and date ranges
Common Workflows
Section titled “Common Workflows”Workflow 1: Setting Up Trap-Driven Backups
Section titled “Workflow 1: Setting Up Trap-Driven Backups”Objective: Automatically backup device configuration when config change traps received.
Steps:
-
Identify Config Change Traps:
- Review Logs for traps from target devices
- Note trap OID for configuration change events
- Example Cisco OID:
1.3.6.1.4.1.9.9.43.2.0.1
-
Create Device Mapping (if needed):
- Navigate to Device Resolution
- Add mapping for trap source IP to rConfig device
- Verify mapping works by checking subsequent trap logs
-
Configure Trap Filter:
- Navigate to Trap Filters
- Click Add, name filter “Config Change - Auto Backup”
- Enter trap OID from step 1
- Select vendor (Cisco)
- Add action: “Download Configuration”
- Set cooldown: 300 seconds (5 minutes)
- Enable filter
-
Test Configuration:
- Make configuration change on test device
- Verify trap appears in logs with filter match
- Confirm backup job created in rConfig
- Validate configuration captured correctly
-
Monitor and Adjust:
- Review dashboard metrics daily
- Adjust cooldown if too many/few backups triggered
- Expand to additional devices as validated
Workflow 2: Resolving “Unknown Trap” Sources
Section titled “Workflow 2: Resolving “Unknown Trap” Sources”Objective: Identify and map unmapped trap sources to rConfig devices.
Steps:
-
Identify Unknown Sources:
- Navigate to Dashboard
- Review Recent Trap Activity
- Note source IPs showing “No device”
-
Cross-Reference with rConfig Inventory:
- Open Devices section
- Search for devices potentially sending traps
- Check device management IP vs. trap source IP
- Identify devices with secondary management interfaces
-
Create Device Mappings:
- Navigate to Device Resolution
- For each unmapped source IP:
- Add mapping to corresponding device
- Document interface in Notes
- Enable mapping
-
Verify Resolution:
- Return to Logs
- Check if new traps from mapped IPs show device names
- Confirm “No device” count decreasing in dashboard
Workflow 3: Troubleshooting Failed Trap Processing
Section titled “Workflow 3: Troubleshooting Failed Trap Processing”Objective: Diagnose and resolve trap processing failures.
Steps:
-
Identify Failures:
- Check Dashboard “Failed Processing” metric
- Navigate to Logs, filter by status: “failed”
- Review failed trap entries
-
Analyze Failure Details:
- Click actions menu on failed trap
- Select “View Details”
- Review error message and processing timeline
- Common issues:
- Device mapping missing
- Filter action failed (backup unreachable device)
- Webhook endpoint unavailable
- Email notification misconfigured
-
Resolve Root Cause:
- For mapping issues: Create device resolution entry
- For action failures: Verify action configuration (email, webhook URL)
- For device issues: Verify device accessibility from rConfig
- For filter problems: Review filter OID and action settings
-
Test Resolution:
- Trigger test trap to verify fix
- Monitor for recurring failures
- Adjust filter or mapping configuration if needed
Performance and Optimization
Section titled “Performance and Optimization”Dashboard Performance
Section titled “Dashboard Performance”Refresh Behavior: Dashboard auto-refreshes every 30 seconds when viewing. Manual refresh available via browser refresh.
Large Dataset Handling: Dashboards with thousands of daily traps may show brief loading delays. This is normal for high-volume environments.
Log Query Optimization
Section titled “Log Query Optimization”For Large Log Tables (100,000+ entries):
- Use specific date ranges rather than “All time”
- Filter by device or source IP before exporting
- Schedule regular log purges for old data
- Consider archiving historical logs externally
Filter Efficiency
Section titled “Filter Efficiency”Optimize Filter Performance:
- Keep total filter count under 100 for optimal performance
- Disable unused or obsolete filters rather than deleting (preserves historical data)
- Use specific trap OIDs rather than wildcard matching
- Monitor processing time metrics in dashboard
Troubleshooting Common Issues
Section titled “Troubleshooting Common Issues”Dashboard Shows “Service Offline”
Section titled “Dashboard Shows “Service Offline””Symptom: Service status indicator shows red “Offline” state.
Resolution:
- Verify Supervisor service status:
Terminal window supervisorctl status rconfig-snmp-trap - If stopped, start service:
Terminal window supervisorctl start rconfig-snmp-trap - If won’t start, review troubleshooting in Supervisor Management
- Refresh dashboard after service startup
Filters Not Matching Traps
Section titled “Filters Not Matching Traps”Symptom: Traps appear in logs but show “No match” despite configured filters.
Resolution:
- Verify filter is enabled (Status column in Trap Filters table)
- Check trap OID in logs matches filter OID exactly
- Review filter configuration for typos in OID
- Verify vendor selection matches trap source device
- Check filter cooldown hasn’t prevented matching (wait cooldown period, retry)
Device Resolution Not Working
Section titled “Device Resolution Not Working”Symptom: Traps still show “No device” after creating mapping.
Resolution:
- Verify mapping is enabled (Status column)
- Confirm IP address entered matches trap source exactly (check Logs)
- Verify device exists in rConfig device inventory
- Check for typos in IP address or device selection
- Try deleting and recreating mapping
Actions Not Executing
Section titled “Actions Not Executing”Symptom: Filters match but actions don’t execute (no backup, no email).
Resolution:
- Check trap detail view for action execution errors
- Verify action configuration in filter settings:
- Backup action: Device is reachable and in rConfig
- Email action: SMTP configured correctly in rConfig
- Webhook action: Endpoint URL is accessible
- Review error logs:
storage/logs/snmp-trap-handler-error.log - Test action manually outside trap handler to verify configuration
Security Considerations
Section titled “Security Considerations”Access Control
Section titled “Access Control”User Permissions: SNMP trap management requires administrative privileges. Ensure only authorized personnel have access to:
- Trap filter configuration (prevents unauthorized automation)
- Device resolution settings (maintains device association integrity)
- Log viewing (trap data may contain sensitive device information)
Sensitive Data in Traps
Section titled “Sensitive Data in Traps”Trap Content Awareness: SNMP traps may contain sensitive information:
- Configuration snippets
- Internal IP addresses and network topology
- User authentication failures with usernames
- System health metrics revealing vulnerabilities
Best Practices:
- Restrict log access to network operations staff only
- Implement log retention policies compliant with data protection requirements
- Sanitize trap data before external integrations (webhooks, tickets)
- Audit filter configurations regularly to prevent unauthorized data exfiltration
Related Documentation
Section titled “Related Documentation”- SNMP Trap Handler Supervisor Management - Service installation and configuration
- SNMP Trap Handler Concepts - Understanding SNMP trap architecture
- Network Services Configuration - Broader network service management
- Device Management - Managing device inventory and connectivity
Quick Reference
Section titled “Quick Reference”Accessing SNMP Trap Interface
Section titled “Accessing SNMP Trap Interface”Navigation: Network Services → SNMP TrapsKey Dashboard Metrics
Section titled “Key Dashboard Metrics”- Traps Today: Total traps received since midnight
- Matched Filters: Traps matching configured rules
- Config Downloads: Backups triggered by traps
- Failed Processing: Traps with processing errors
Creating a Basic Filter
Section titled “Creating a Basic Filter”- Navigate to Trap Filters tab
- Click Add button
- Enter Name (required), Description, Trap OID (required)
- Select Vendor (required)
- Configure Actions (Download Configuration, Send Email, etc.)
- Set Status to Enabled
- Click Save
Creating Device Mapping
Section titled “Creating Device Mapping”- Navigate to Device Resolution tab
- Click Add button
- Select Device from dropdown (required)
- Enter trap source IP Address (required)
- Add Notes documenting interface/purpose
- Set Status to Enabled
- Click Save
Viewing Trap Details
Section titled “Viewing Trap Details”- Navigate to Logs tab
- Locate trap record in table
- Click actions menu (⋯)
- Select “View Details”
- Review complete trap information and processing timeline