Database Optimization
Database Optimization: Performance Tuning and Maintenance for rConfig V8
Section titled “Database Optimization: Performance Tuning and Maintenance for rConfig V8”rConfig V8 relies on efficient database operations to manage device configurations, historical data, and system operations. Proper database configuration directly impacts query performance, write throughput, and the ability to handle large-scale network management operations across thousands of devices.
This addresses the challenge of database systems’ default conservative resource limits, which are designed for general-purpose applications but inadequate for configuration management systems storing millions of historical records and processing thousands of concurrent device operations. Organizations can leverage database tuning to eliminate slow queries, reduce disk I/O bottlenecks, and maintain responsive operations under heavy load.
Accessing Database Optimization Recommendations
Section titled “Accessing Database Optimization Recommendations”rConfig V8 provides a comprehensive Database Optimization interface accessible at System Settings → System Optimization. This page displays a detailed analysis of your current database configuration compared against recommended values for optimal performance.
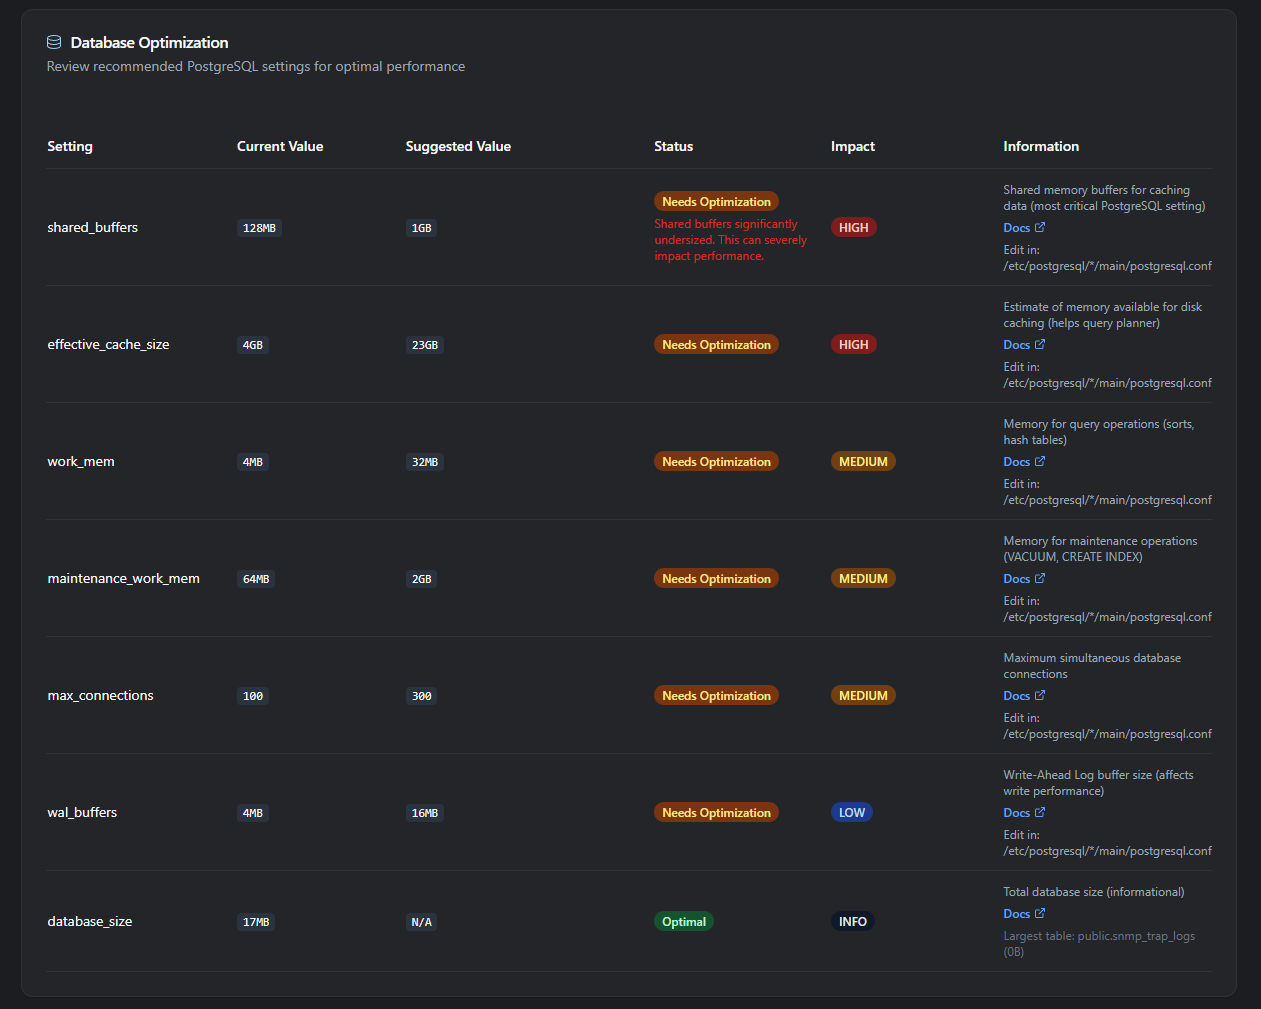
The Database Optimization card presents each database setting in a clear tabular format showing:
- Setting name: The specific database parameter being evaluated
- Current Value: Your active configuration
- Suggested Value: Recommended setting based on your hardware and deployment size
- Status: Visual indicator showing “Optimal” (green) or “Needs Optimization” (yellow/red)
- Impact: Priority level (HIGH, MEDIUM, LOW, INFO) indicating performance significance
- Information: Detailed description of the setting’s purpose and configuration file location
- Documentation links: Direct access to relevant configuration guidance
Settings are automatically categorized by impact level, with HIGH impact settings like shared_buffers (PostgreSQL) or innodb_buffer_pool_size (MySQL/MariaDB) prominently highlighted. The interface also displays warnings for critically undersized configurations that can severely impact performance.
This real-time analysis eliminates guesswork in database tuning, providing specific, actionable recommendations tailored to your server’s memory capacity and database size. The system automatically detects your database type (MySQL, MariaDB, or PostgreSQL) and presents appropriate settings for your configuration.
Understanding Critical Database Settings
Section titled “Understanding Critical Database Settings”Buffer Pool / Shared Buffers
Section titled “Buffer Pool / Shared Buffers”The buffer pool (MySQL/MariaDB) or shared buffers (PostgreSQL) is the most critical database setting for performance. This in-memory cache stores frequently accessed table data and indexes, dramatically reducing disk I/O and improving query response times.
For rConfig operations, adequate buffer allocation is essential when:
- Querying configuration history across millions of archived device snapshots
- Executing compliance checks that scan large configuration datasets
- Generating reports that aggregate data from multiple large tables
- Processing device polling operations across hundreds of concurrent connections
- Running searches across configuration text spanning gigabytes of data
Insufficient buffer allocation manifests as slow query performance, high disk I/O, and degraded system responsiveness. A properly sized buffer pool can improve query performance by 95% or more, as demonstrated in production deployments where increasing from 128MB to 10GB eliminated performance bottlenecks.
Example Performance Impact:
Before (128MB buffer pool, 7.9GB database):- Configuration migration: 38 minutes- Heavy disk I/O, query timeouts
After (10GB buffer pool, 7.9GB database):- Configuration migration: ~2 minutes- 95% performance improvement
Max Connections
Section titled “Max Connections”The max_connections setting controls the maximum number of simultaneous database connections. For rConfig, this impacts:
- Web interface users browsing concurrently
- Background queue workers processing device tasks
- API integrations querying configuration data
- Scheduled jobs running database maintenance
- Monitoring systems checking database health
Insufficient connection limits cause “Too many connections” errors, preventing legitimate operations from accessing the database and requiring manual intervention.
Write-Ahead Logging (WAL) / Redo Logs
Section titled “Write-Ahead Logging (WAL) / Redo Logs”Write-ahead logging settings control how database writes are buffered and committed to disk. For rConfig, this impacts:
- Configuration change commits during device polling
- Task execution logging to database
- User activity tracking and audit trails
- Large bulk operations like policy assignments
- Database backup and recovery operations
Properly sized log files improve write performance and reduce checkpoint overhead, while undersized logs cause frequent disk flushes and performance degradation.
Database Version Support
Section titled “Database Version Support”rConfig V8 supports multiple database systems. Choose based on your organization’s existing infrastructure and expertise:
MySQL/MariaDB (Recommended for most deployments)
- Mature, well-documented InnoDB storage engine
- Extensive tooling and community support
- Proven performance at scale
- Easier administration for general users
PostgreSQL (Recommended for advanced deployments)
- Advanced features and query optimization
- Superior handling of concurrent writes
- More configurable performance tuning
- Better for very large datasets (10GB+)
Using the Database Optimization Interface
Section titled “Using the Database Optimization Interface”The System Settings → System Optimization page provides comprehensive analysis of your database configuration:
Key Features:
- Automatic database detection: Identifies MySQL/MariaDB or PostgreSQL and displays relevant settings
- Smart recommendations: Calculates optimal values based on available system RAM and current database size
- Impact prioritization: Highlights HIGH impact settings requiring immediate attention
- Real-time status: Shows which settings are optimal and which need adjustment
- Configuration paths: Displays exact file locations for making changes
- Warning system: Alerts for critically undersized configurations (e.g., buffer pool < 50% of recommended)
Additional Monitoring:
- Database size tracking: Shows total database size and largest table information
- Table maintenance alerts: Identifies fragmented (MySQL/MariaDB) or bloated (PostgreSQL) tables exceeding thresholds
- Connection monitoring: Tracks max_connections against recommended values
Navigate to the page periodically to monitor database health and verify optimization efforts. After making configuration changes, use the Refresh button to clear the cache and view updated settings immediately.
Recommended Configuration Values
Section titled “Recommended Configuration Values”Buffer Pool / Shared Buffers Guidelines
Section titled “Buffer Pool / Shared Buffers Guidelines”Memory allocation for database caching should scale with available RAM and database size:
MySQL/MariaDB: innodb_buffer_pool_size
Section titled “MySQL/MariaDB: innodb_buffer_pool_size”| Server RAM | Database Size | Recommended innodb_buffer_pool_size | Deployment Size |
|---|---|---|---|
| 4GB | < 2GB | 2GB | Small: < 500 devices |
| 8GB | < 4GB | 6GB | Medium: 500-1,000 devices |
| 16GB | < 10GB | 10GB | Large: 1,000-5,000 devices |
| 32GB+ | < 20GB | 22GB | Enterprise: 10,000+ devices |
Rule of thumb: Allocate 70-75% of available RAM to the buffer pool, or 125% of database size (whichever is smaller).
PostgreSQL: shared_buffers
Section titled “PostgreSQL: shared_buffers”| Server RAM | Database Size | Recommended shared_buffers | Deployment Size |
|---|---|---|---|
| 4GB | < 2GB | 1GB | Small: < 500 devices |
| 8GB | < 4GB | 2GB | Medium: 500-1,000 devices |
| 16GB | < 10GB | 4GB | Large: 1,000-5,000 devices |
| 32GB+ | < 20GB | 8GB | Enterprise: 10,000+ devices |
Rule of thumb: Allocate 25% of available RAM to shared buffers (PostgreSQL is more conservative than MySQL).
Connection Limits Guidelines
Section titled “Connection Limits Guidelines”Connection limits should accommodate concurrent operations:
| Server RAM | Recommended max_connections | Rationale |
|---|---|---|
| 4GB | 100-150 | Limited concurrent web users and workers |
| 8GB | 200 | Moderate concurrent operations |
| 16GB | 300 | High concurrent operations |
| 32GB+ | 500 | Enterprise-scale concurrent operations |
Write-Ahead Log / Redo Log Guidelines
Section titled “Write-Ahead Log / Redo Log Guidelines”MySQL/MariaDB: innodb_log_file_size
Section titled “MySQL/MariaDB: innodb_log_file_size”| Server RAM | Recommended innodb_log_file_size | Workload Type |
|---|---|---|
| 4GB | 256MB | Light write operations |
| 8GB | 512MB | Moderate write operations |
| 16GB | 1GB | Heavy write operations |
| 32GB+ | 2GB | Very heavy write operations |
PostgreSQL: wal_buffers
Section titled “PostgreSQL: wal_buffers”| Server RAM | Recommended wal_buffers | Workload Type |
|---|---|---|
| All sizes | 16MB | Standard for most workloads |
Modifying Database Settings
Section titled “Modifying Database Settings”Configuration File Locations
Section titled “Configuration File Locations”Common locations:
- Ubuntu/Debian:
/etc/mysql/mariadb.conf.d/50-server.cnfor/etc/mysql/mysql.conf.d/mysqld.cnf - CentOS/RHEL/Rocky/AlmaLinux:
/etc/my.cnf.d/server.cnfor/etc/my.cnf
Locate active configuration:
mysql -u root -p -e "SHOW VARIABLES LIKE 'datadir';"Settings are placed under the [mysqld] section.
Common locations:
- Ubuntu/Debian:
/etc/postgresql/14/main/postgresql.conf(version may vary) - CentOS/RHEL/Rocky/AlmaLinux:
/var/lib/pgsql/14/data/postgresql.conf(version may vary)
Locate active configuration:
sudo -u postgres psql -c "SHOW config_file;"Settings are placed directly in the file (no sections).
Step-by-Step Configuration Procedure
Section titled “Step-by-Step Configuration Procedure”Step 1: Identify Configuration File
Section titled “Step 1: Identify Configuration File”# Find the active configuration filemysql -u root -p -e "SHOW VARIABLES LIKE 'datadir';"
# Common locationsls -la /etc/mysql/mariadb.conf.d/50-server.cnfls -la /etc/my.cnf.d/server.cnfStep 2: Create Configuration Backup
Section titled “Step 2: Create Configuration Backup”# Ubuntu/Debiansudo cp /etc/mysql/mariadb.conf.d/50-server.cnf /etc/mysql/mariadb.conf.d/50-server.cnf.backup.$(date +%Y%m%d)
# CentOS/RHEL/Rocky/AlmaLinuxsudo cp /etc/my.cnf.d/server.cnf /etc/my.cnf.d/server.cnf.backup.$(date +%Y%m%d)Step 3: Edit Configuration File
Section titled “Step 3: Edit Configuration File”# Ubuntu/Debiansudo nano /etc/mysql/mariadb.conf.d/50-server.cnf
# CentOS/RHEL/Rocky/AlmaLinuxsudo nano /etc/my.cnf.d/server.cnfStep 4: Add/Modify Settings Under [mysqld]
Section titled “Step 4: Add/Modify Settings Under [mysqld]”Locate the [mysqld] section and add or modify these settings based on your server specifications:
[mysqld]# InnoDB Buffer Pool (MOST CRITICAL - adjust based on RAM)innodb_buffer_pool_size = 10Ginnodb_buffer_pool_instances = 8
# Connection Settingsmax_connections = 300
# InnoDB Log Files (improves write performance)innodb_log_file_size = 1Ginnodb_flush_log_at_trx_commit = 2innodb_flush_method = O_DIRECT
# Temporary Tablestmp_table_size = 64Mmax_heap_table_size = 64M
# Query Optimizationslow_query_log = 1long_query_time = 2slow_query_log_file = /var/log/mysql/slow-query.log
# Thread Cachethread_cache_size = 100
# Disable Query Cache (deprecated in MySQL 8.0, causes contention in MariaDB)query_cache_type = 0query_cache_size = 0
Key settings explained:
innodb_buffer_pool_size: Most critical setting - set to 70% of RAM or 125% of database sizeinnodb_buffer_pool_instances: Set to 8 for buffer pools > 1GB (improves concurrency)max_connections: Set based on concurrent operations (see guidelines above)innodb_log_file_size: Larger values improve write performanceinnodb_flush_log_at_trx_commit = 2: Improves performance (slightly less crash-safe)innodb_flush_method = O_DIRECT: Prevents double buffering with OS cacheslow_query_log: Enable to identify performance issuesquery_cache_type = 0: Disable query cache (deprecated/problematic)
Step 5: Validate Configuration
Section titled “Step 5: Validate Configuration”# Test configuration syntax (MariaDB)sudo mysqld --help --verbose | head -n 20
# Look for errors in outputStep 6: Restart Database Service
Section titled “Step 6: Restart Database Service”# Ubuntu/Debiansudo systemctl restart mariadbsudo systemctl status mariadb
# CentOS/RHEL/Rocky/AlmaLinuxsudo systemctl restart mariadbsudo systemctl status mariadbStep 7: Verify Settings Applied
Section titled “Step 7: Verify Settings Applied”mysql -u root -p -e "SHOW VARIABLES LIKE 'innodb_buffer_pool_size';"mysql -u root -p -e "SHOW VARIABLES LIKE 'max_connections';"mysql -u root -p -e "SHOW VARIABLES LIKE 'innodb_log_file_size';"Step 8: Verify in rConfig
Section titled “Step 8: Verify in rConfig”- Navigate to System Settings → System Optimization
- Click Refresh to clear cache
- Review Database Settings section
- Verify settings show as optimal
Step 1: Identify Configuration File
Section titled “Step 1: Identify Configuration File”# Find the active configuration filesudo -u postgres psql -c "SHOW config_file;"
# Common locationsls -la /etc/postgresql/14/main/postgresql.confls -la /var/lib/pgsql/14/data/postgresql.confStep 2: Create Configuration Backup
Section titled “Step 2: Create Configuration Backup”# Ubuntu/Debiansudo cp /etc/postgresql/14/main/postgresql.conf /etc/postgresql/14/main/postgresql.conf.backup.$(date +%Y%m%d)
# CentOS/RHEL/Rocky/AlmaLinuxsudo cp /var/lib/pgsql/14/data/postgresql.conf /var/lib/pgsql/14/data/postgresql.conf.backup.$(date +%Y%m%d)Step 3: Edit Configuration File
Section titled “Step 3: Edit Configuration File”# Ubuntu/Debiansudo nano /etc/postgresql/14/main/postgresql.conf
# CentOS/RHEL/Rocky/AlmaLinuxsudo nano /var/lib/pgsql/14/data/postgresql.confStep 4: Modify Settings
Section titled “Step 4: Modify Settings”Locate and modify these settings based on your server specifications:
# Memory Settings (MOST CRITICAL)shared_buffers = 4GB                    # 25% of RAMeffective_cache_size = 12GB             # 75% of RAMwork_mem = 32MB                         # Per-operation memorymaintenance_work_mem = 1600MB           # For VACUUM, indexing
# Connection Settingsmax_connections = 300
# Write-Ahead Logwal_buffers = 16MBcheckpoint_completion_target = 0.9
# Query Planner (adjust for SSD storage)random_page_cost = 1.1effective_io_concurrency = 200
# Logging (for performance monitoring)log_min_duration_statement = 2000       # Log queries > 2 seconds
Key settings explained:
shared_buffers: Most critical setting - set to 25% of RAM (PostgreSQL is conservative)effective_cache_size: Helps query planner - set to 75% of RAMwork_mem: Memory per sort/hash operation - balance against max_connectionsmaintenance_work_mem: For VACUUM and CREATE INDEX - set to 10% of RAM (max 2GB)max_connections: Set based on concurrent operationswal_buffers: Write-ahead log buffers - 16MB standardcheckpoint_completion_target: Spreads checkpoint I/O over timerandom_page_cost: Lower for SSD (1.1) vs HDD (4.0)effective_io_concurrency: Higher for SSD storage
Step 5: Validate Configuration
Section titled “Step 5: Validate Configuration”# Check for syntax errorssudo -u postgres /usr/lib/postgresql/14/bin/postgres -C shared_buffers -D /etc/postgresql/14/main/
# Look for errors in outputStep 6: Restart Database Service
Section titled “Step 6: Restart Database Service”# Ubuntu/Debiansudo systemctl restart postgresqlsudo systemctl status postgresql
# CentOS/RHEL/Rocky/AlmaLinuxsudo systemctl restart postgresql-14sudo systemctl status postgresql-14Step 7: Verify Settings Applied
Section titled “Step 7: Verify Settings Applied”sudo -u postgres psql -c "SHOW shared_buffers;"sudo -u postgres psql -c "SHOW effective_cache_size;"sudo -u postgres psql -c "SHOW max_connections;"sudo -u postgres psql -c "SHOW work_mem;"Step 8: Verify in rConfig
Section titled “Step 8: Verify in rConfig”- Navigate to System Settings → System Optimization
- Click Refresh to clear cache
- Review Database Settings section
- Verify settings show as optimal
Database Maintenance Tasks
Section titled “Database Maintenance Tasks”Table Fragmentation / Bloat
Section titled “Table Fragmentation / Bloat”Over time, database tables accumulate fragmentation (MySQL/MariaDB) or bloat (PostgreSQL), reducing query performance and wasting disk space.
Detection: The rConfig optimization page automatically detects fragmented or bloated tables exceeding thresholds:
- MySQL/MariaDB: >20% fragmentation and >100MB size
- PostgreSQL: >20% dead tuple ratio and >10,000 dead tuples
Resolution:
# Optimize specific fragmented tablesmysql -u root -p rconfig_db -e "OPTIMIZE TABLE config_changes;"mysql -u root -p rconfig_db -e "OPTIMIZE TABLE device_history;"mysql -u root -p rconfig_db -e "OPTIMIZE TABLE task_logs;"
# Optimize all tables (WARNING: can take hours on large databases)mysqlcheck -u root -p --optimize --all-databases
Scheduling regular maintenance:
# Create cron job for weekly optimization (Sunday 2 AM)sudo crontab -e
# Add line:0 2 * * 0 mysqlcheck -u root -p'YOUR_PASSWORD' --optimize rconfig_db >> /var/log/mysql-optimize.log 2>&1# VACUUM specific bloated tables (releases dead tuples)sudo -u postgres psql rconfig_db -c "VACUUM ANALYZE config_changes;"sudo -u postgres psql rconfig_db -c "VACUUM ANALYZE device_history;"sudo -u postgres psql rconfig_db -c "VACUUM ANALYZE task_logs;"
# VACUUM FULL (WARNING: locks table, reclaims disk space)sudo -u postgres psql rconfig_db -c "VACUUM FULL ANALYZE config_changes;"
# Alternative: pg_repack (online, no lock - requires installation)pg_repack -d rconfig_db -t config_changesScheduling regular maintenance:
# PostgreSQL autovacuum should handle routine maintenance automatically# Verify autovacuum is enabled:sudo -u postgres psql -c "SHOW autovacuum;"
# For manual weekly VACUUM (Sunday 2 AM):sudo crontab -e
# Add line:0 2 * * 0 /usr/bin/vacuumdb -U postgres -d rconfig_db -z >> /var/log/postgres-vacuum.log 2>&1Monitoring Database Performance
Section titled “Monitoring Database Performance”Using Built-in rConfig Monitoring
Section titled “Using Built-in rConfig Monitoring”Navigate to System Settings → System Optimization to view:
- Current vs. recommended settings with impact levels
- Database size and largest tables
- Table fragmentation or bloat status
- Connection usage patterns
Impact Levels:
- HIGH: Critical performance impact - address immediately
- MEDIUM: Moderate impact - address during next maintenance
- LOW: Minor impact - address when convenient
- INFO: Informational only
Command-Line Monitoring
Section titled “Command-Line Monitoring”Monitor current connections:
mysql -u root -p -e "SHOW PROCESSLIST;"mysql -u root -p -e "SHOW STATUS LIKE 'Threads_connected';"mysql -u root -p -e "SHOW STATUS LIKE 'Max_used_connections';"Monitor buffer pool efficiency:
mysql -u root -p -e "SHOW STATUS LIKE 'Innodb_buffer_pool%';"View slow queries:
sudo tail -100 /var/log/mysql/slow-query.logCheck table sizes:
mysql -u root -p -e "SELECT table_name, ROUND(((data_length + index_length) / 1024 / 1024), 2) AS 'Size (MB)'FROM information_schema.TABLESWHERE table_schema = 'rconfig_db'ORDER BY (data_length + index_length) DESCLIMIT 10;"Monitor current connections:
sudo -u postgres psql -c "SELECT count(*) FROM pg_stat_activity;"sudo -u postgres psql -c "SELECT * FROM pg_stat_activity WHERE state = 'active';"Monitor cache hit ratio (should be >99%):
sudo -u postgres psql -c "SELECT sum(heap_blks_read) as heap_read, sum(heap_blks_hit) as heap_hit, sum(heap_blks_hit) / (sum(heap_blks_hit) + sum(heap_blks_read)) as ratioFROM pg_statio_user_tables;"View slow queries:
sudo -u postgres psql -c "SELECT query, calls, total_time, mean_timeFROM pg_stat_statementsORDER BY mean_time DESCLIMIT 10;"Check table sizes:
sudo -u postgres psql -c "SELECT schemaname || '.' || tablename AS table, pg_size_pretty(pg_total_relation_size(schemaname || '.' || tablename)) AS sizeFROM pg_tablesWHERE schemaname = 'public'ORDER BY pg_total_relation_size(schemaname || '.' || tablename) DESCLIMIT 10;"Troubleshooting Common Issues
Section titled “Troubleshooting Common Issues”Symptom: Database Won’t Start After Configuration Changes
Section titled “Symptom: Database Won’t Start After Configuration Changes”Diagnosis: Configuration error or resource limits exceeded.
Resolution:
-
Check error logs:
Terminal window # MySQL/MariaDBsudo tail -100 /var/log/mysql/error.log# PostgreSQLsudo tail -100 /var/log/postgresql/postgresql-14-main.log -
Common issues:
- MySQL innodb_log_file_size changed: Remove old log files (
ib_logfile*) and restart - PostgreSQL shared_buffers too large: System shared memory limits need adjustment
- Syntax errors: Typos in configuration file
- MySQL innodb_log_file_size changed: Remove old log files (
-
Restore backup configuration:
Terminal window sudo cp /etc/my.cnf.d/server.cnf.backup.YYYYMMDD /etc/my.cnf.d/server.cnfsudo systemctl restart mariadb -
Contact rConfig support if issue persists
Symptom: “Too Many Connections” Errors
Section titled “Symptom: “Too Many Connections” Errors”Diagnosis: max_connections limit reached.
Resolution:
-
Check current connection usage:
Terminal window # MySQL/MariaDBmysql -u root -p -e "SHOW STATUS LIKE 'Threads_connected';"mysql -u root -p -e "SHOW PROCESSLIST;"# PostgreSQLsudo -u postgres psql -c "SELECT count(*) FROM pg_stat_activity;" -
Identify connection sources (web users, queue workers, integrations)
-
Increase max_connections in configuration (see guidelines above)
-
Restart database service
-
Contact rConfig support if connections seem excessive (may indicate connection leak)
Symptom: Slow Query Performance Despite Buffer Tuning
Section titled “Symptom: Slow Query Performance Despite Buffer Tuning”Diagnosis: Missing indexes, inefficient queries, or bloated tables.
Resolution:
-
Check for table fragmentation/bloat in System Optimization page
-
Run OPTIMIZE TABLE (MySQL) or VACUUM (PostgreSQL) on identified tables
-
Enable slow query logging and review problematic queries
-
Contact rConfig support for query optimization assistance
Symptom: Settings Don’t Appear Changed in rConfig
Section titled “Symptom: Settings Don’t Appear Changed in rConfig”Diagnosis: Cache not cleared after configuration change.
Resolution:
-
Click Refresh button in System Optimization page to clear cache
-
Verify database service was restarted after configuration change
-
Confirm correct configuration file was modified (check paths above)
Best Practices
Section titled “Best Practices”Security
Section titled “Security”Backup before changes: Always create timestamped backups of configuration files before modifications. This enables rapid recovery if settings cause issues.
Test in non-production first: Validate configuration changes in staging environments when possible to identify issues before production impact.
Monitor resource usage: After configuration changes, monitor system memory, disk I/O, and CPU usage to ensure settings don’t cause resource exhaustion.
Performance
Section titled “Performance”Start conservative, adjust based on monitoring: Begin with recommended values, then fine-tune based on actual usage patterns observed through monitoring.
Prioritize buffer pool / shared buffers: This setting has the largest performance impact. Allocate generously before optimizing other settings.
Balance memory across settings: Ensure total memory allocation (buffer pool + connections + OS + applications) doesn’t exceed available RAM.
Schedule maintenance during off-hours: Table optimization operations can lock tables or consume significant resources. Schedule during maintenance windows.
Organization
Section titled “Organization”Document configuration changes: Maintain internal documentation noting database settings, when they were changed, and why. Include before/after performance metrics when available.
Version control configuration files: Store copies of database configuration files in version control for audit trails and rapid restoration after server rebuilds.
Review settings quarterly: As deployments grow, revisit database configuration quarterly to ensure settings remain adequate for current scale.
When to Contact rConfig Support
Section titled “When to Contact rConfig Support”Consult rConfig support when:
- Database won’t start after configuration changes and logs are unclear
- Performance issues persist despite following optimization guidelines
- Uncertain about safe values for your specific hardware configuration
- Managing extremely large deployments (10,000+ devices, 100GB+ databases)
- Migrating between database systems (MySQL to PostgreSQL or vice versa)
- Experiencing connection leaks or abnormal connection patterns
- Planning major version upgrades of database software
Support can provide:
- Configuration review and validation
- Performance profiling and bottleneck identification
- Hardware sizing recommendations
- Migration assistance and planning
- Custom optimization for specific workloads
Related Documentation
Section titled “Related Documentation”- System Requirements - Hardware and software prerequisites including database version requirements
- Installation Guide - Initial rConfig setup including database configuration
- PHP Settings - PHP optimization that complements database tuning
- System Logs - Viewing database errors and slow queries
- Performance Tuning - Comprehensive performance optimization strategies
Quick Reference
Section titled “Quick Reference”Critical Settings Summary
Section titled “Critical Settings Summary”| Setting | MySQL/MariaDB | PostgreSQL | Impact |
|---|---|---|---|
| Buffer Cache | innodb_buffer_pool_size | shared_buffers | HIGH |
| Query Planner Cache | N/A | effective_cache_size | HIGH |
| Connections | max_connections | max_connections | MEDIUM |
| Write-Ahead Logs | innodb_log_file_size | wal_buffers | MEDIUM |
| Temp Memory | tmp_table_size | work_mem | LOW |
| Maintenance Memory | N/A | maintenance_work_mem | LOW |
Configuration File Quick Access
Section titled “Configuration File Quick Access”# MySQL/MariaDBsudo nano /etc/my.cnf.d/server.cnfsudo systemctl restart mariadb
# PostgreSQLsudo nano /etc/postgresql/14/main/postgresql.confsudo systemctl restart postgresqlVerification Commands
Section titled “Verification Commands”# MySQL/MariaDBmysql -u root -p -e "SHOW VARIABLES LIKE 'innodb_buffer_pool_size';"
# PostgreSQLsudo -u postgres psql -c "SHOW shared_buffers;"Summary
Section titled “Summary”Proper database configuration is fundamental to rConfig V8 performance at scale. The buffer pool (MySQL/MariaDB) or shared buffers (PostgreSQL) represents the single most important performance setting, with properly sized allocation improving query performance by 95% or more in production deployments.
Key takeaways for effective database optimization:
- Allocate 70-75% of RAM to buffer pool (MySQL/MariaDB) or 25% to shared buffers (PostgreSQL) on dedicated servers
- Monitor and adjust based on actual usage rather than relying solely on generic recommendations
- Schedule regular maintenance to address table fragmentation and bloat
- Use rConfig’s built-in optimization page to identify and track configuration issues
- Contact rConfig support when uncertain about changes or experiencing persistent performance issues
The rConfig optimization interface provides real-time monitoring and recommendations tailored to your specific deployment, making database tuning accessible without deep database administration expertise. Regular review and adjustment ensures rConfig maintains reliable, performant operations as deployments scale.