Live Debug Console (V8.2.0+)
Live Debug Console
Section titled “Live Debug Console”The Live Debug Console runs the same debug backup that php artisan rconfig:download-device <id> -d runs from the shell, but it does so from inside the rConfig web UI, streams the output back live, and pairs it with a connection-parameters card and a rule-based analysis panel. It is the fastest way to diagnose a misbehaving device backup without leaving the browser.
When to use this
Section titled “When to use this”Use the Live Debug Console when a device backup is failing or behaving unexpectedly and you need real-time, line-by-line visibility into the connection and command output, without needing shell access to the rConfig server.
Prerequisites
Section titled “Prerequisites”- rConfig V8.2.0 or later.
- The device must not be bound to a remote rConfig Agent (Agent ID other than
1); agent-bound devices require the CLI debug command run on the agent host. device.viewpermission and access to the device’s detail view.
Interactive Video
Section titled “Interactive Video”Launching the Console
Section titled “Launching the Console”The console is launched from the device view header.
- Navigate to Devices and open the device you want to troubleshoot.
- In the device action bar (top right of the device view), click Run Debug, the button next to Copy Debug Command.
The dialog opens immediately in an idle state. No backup is started until you press Run Live Debug.
Anatomy of the Console
Section titled “Anatomy of the Console”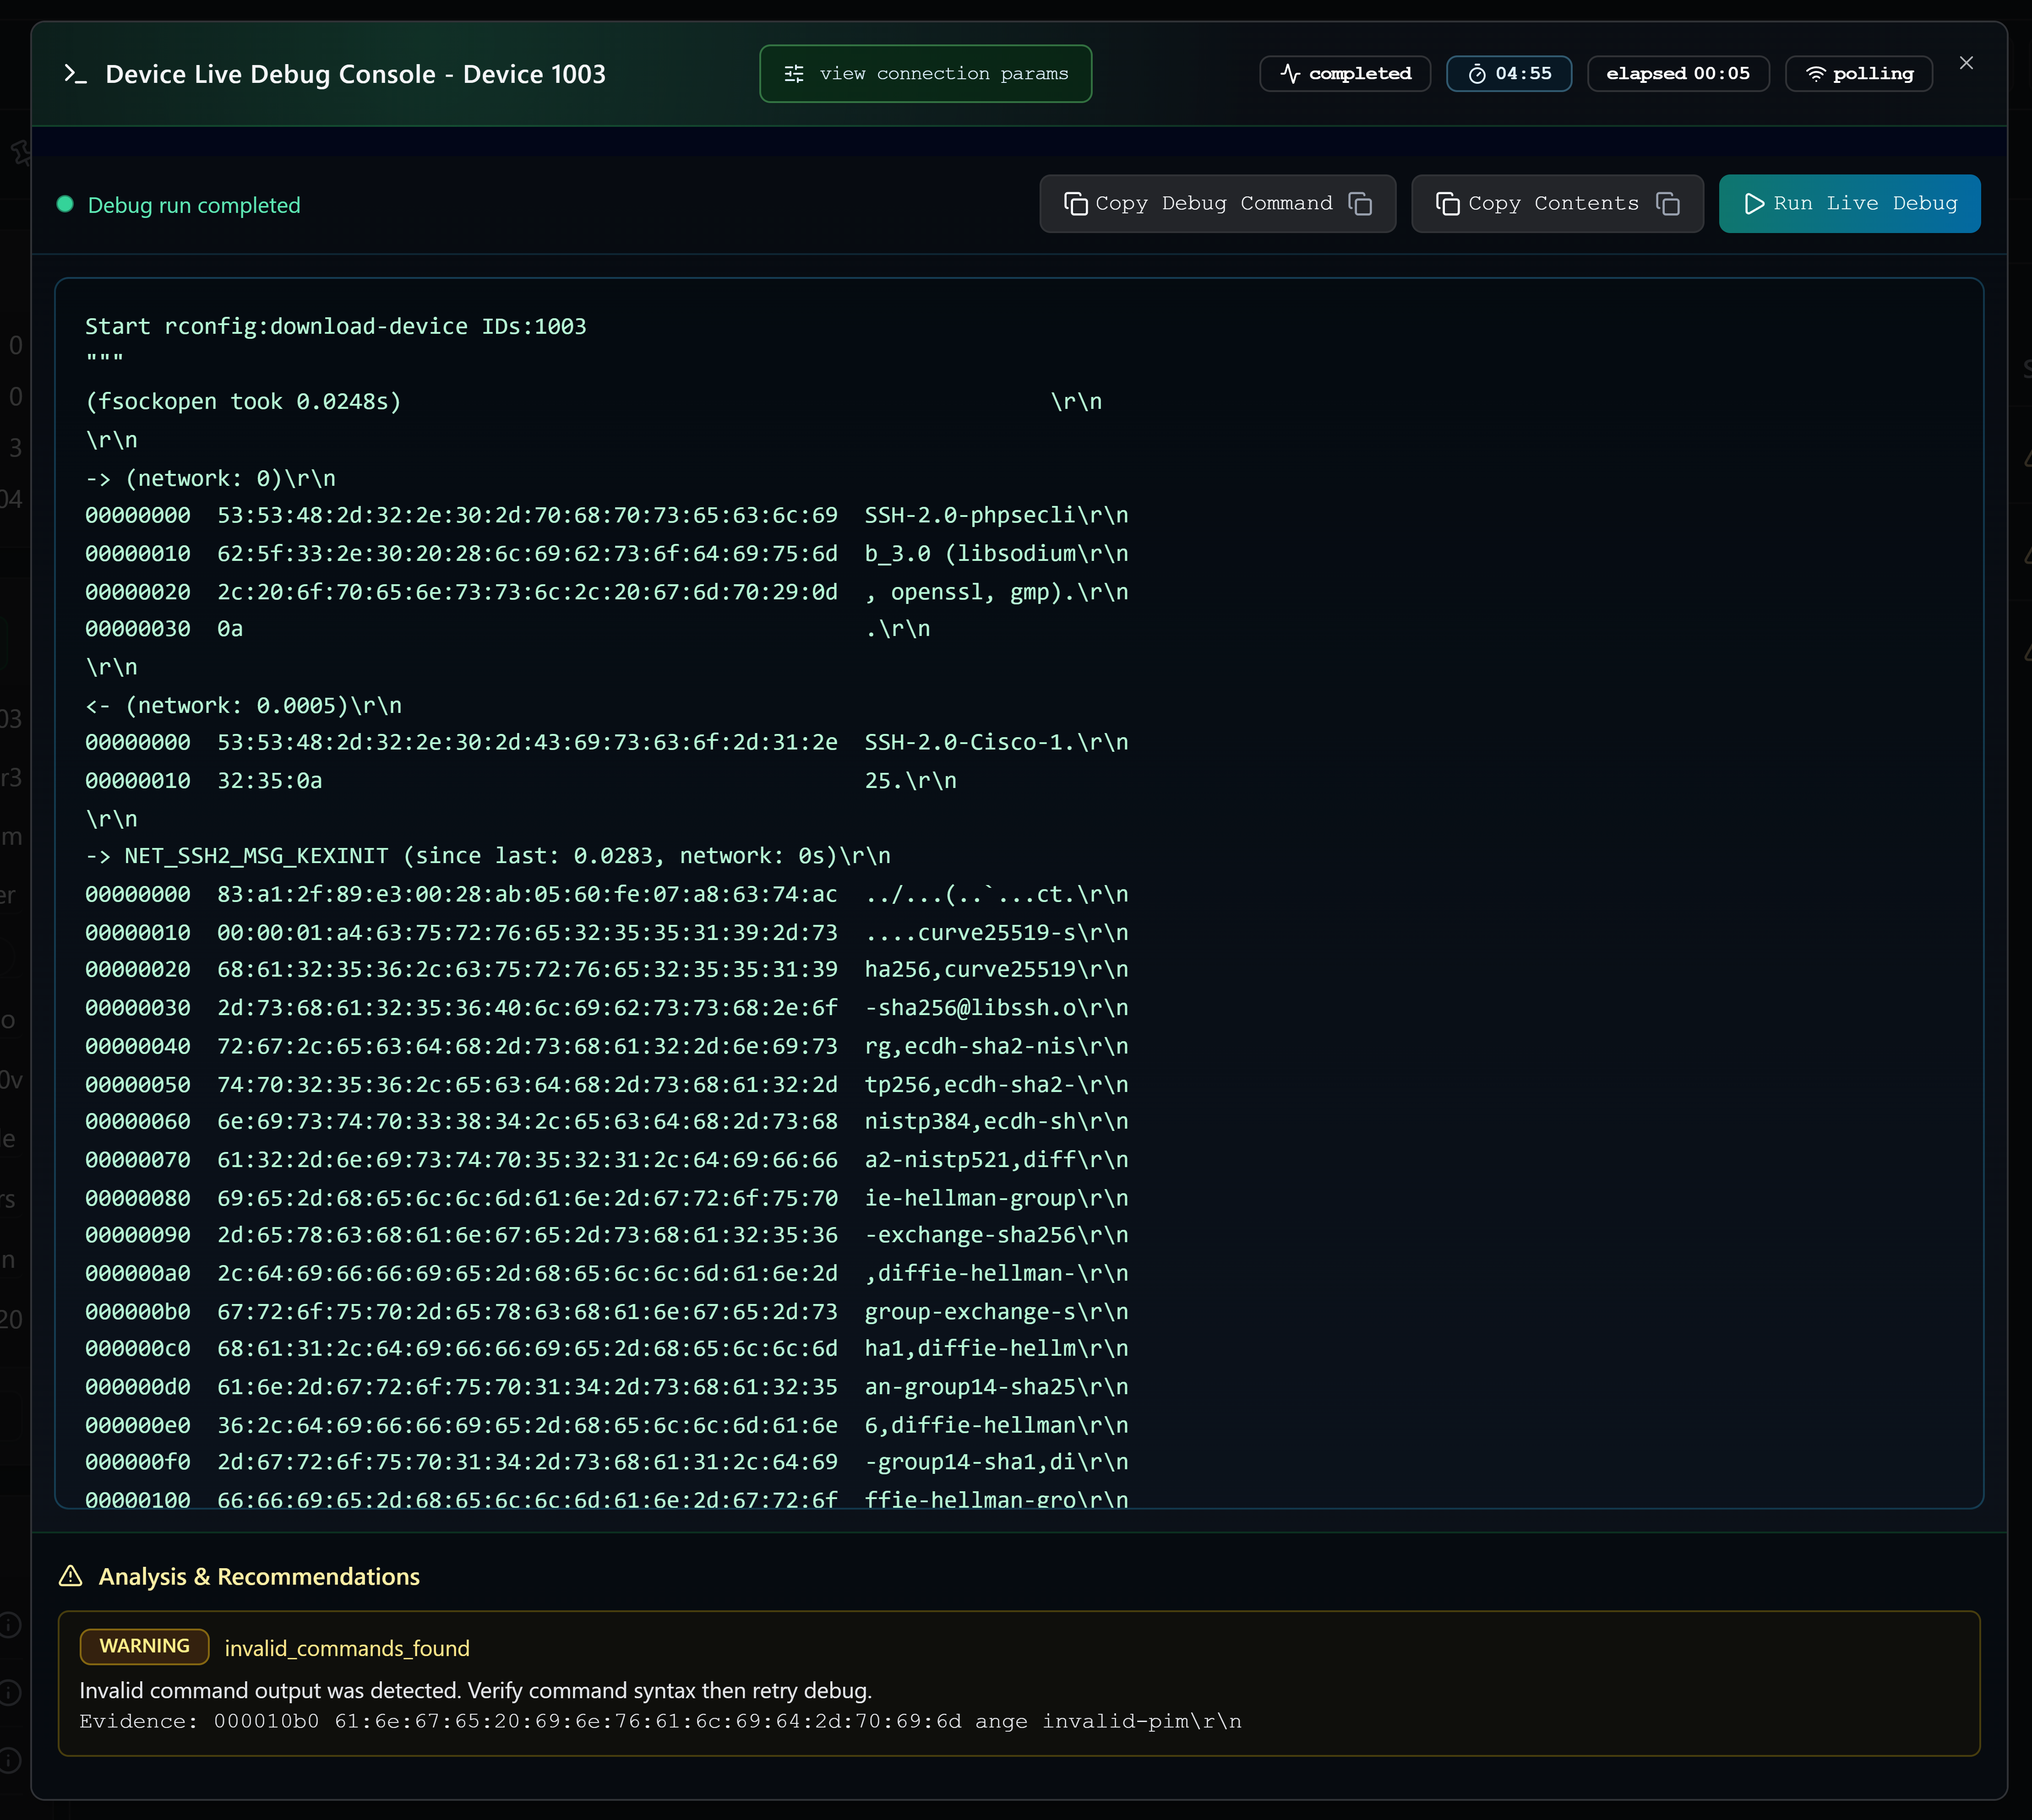
The console is divided into four regions, top to bottom:
1. Header & Status Badges
Section titled “1. Header & Status Badges”The header carries the device identifier and a row of status badges that update in real time during a run:
- Status badge:
idle,queued,starting,running,completed,failed,timed_out, orcancelled. - Countdown badge: Time remaining before the in-browser session reaches the 5-minute UI wait limit.
- Max wait warning: A pulsing red badge appears once you cross the warning threshold (4 minutes). Hovering it explains the 5-minute UI cap and what to do if the run needs longer.
- Elapsed badge:
mm:sssince the run was started. - Stream mode badge:
ssewhen streamed via Server-Sent Events,pollingwhen the browser has fallen back to 2-second HTTP polling, ordisconnectedwhen no stream is active.
2. Action Toolbar
Section titled “2. Action Toolbar”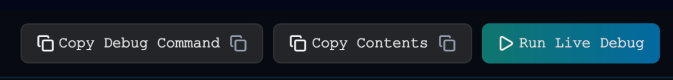
The toolbar exposes three actions:
- Run Live Debug: Starts a new debug run for the current device. Disabled while a run is already streaming. If a run is already in progress (because someone else is debugging the same device, or the dialog was reopened), the API returns a 409 and the console will automatically attach to the existing run instead of starting a duplicate.
- Copy Debug Command: Copies the equivalent CLI command to the clipboard:
Hand this off to the CLI when a run will exceed the 5-minute UI window or when collecting output for support.
Terminal window cd /var/www/html/rconfig8/current && php artisan rconfig:download-device <device_id> -d - Copy Contents: Appears once a run completes. Copies the entire captured debug output to the clipboard for pasting into a ticket, chat, or text editor.
3. View Connection Params
Section titled “3. View Connection Params”A View Connection Params popover lives in the header. Opening it lazy-loads the device’s current configuration so you can compare what rConfig is expecting against what the live stream is seeing:
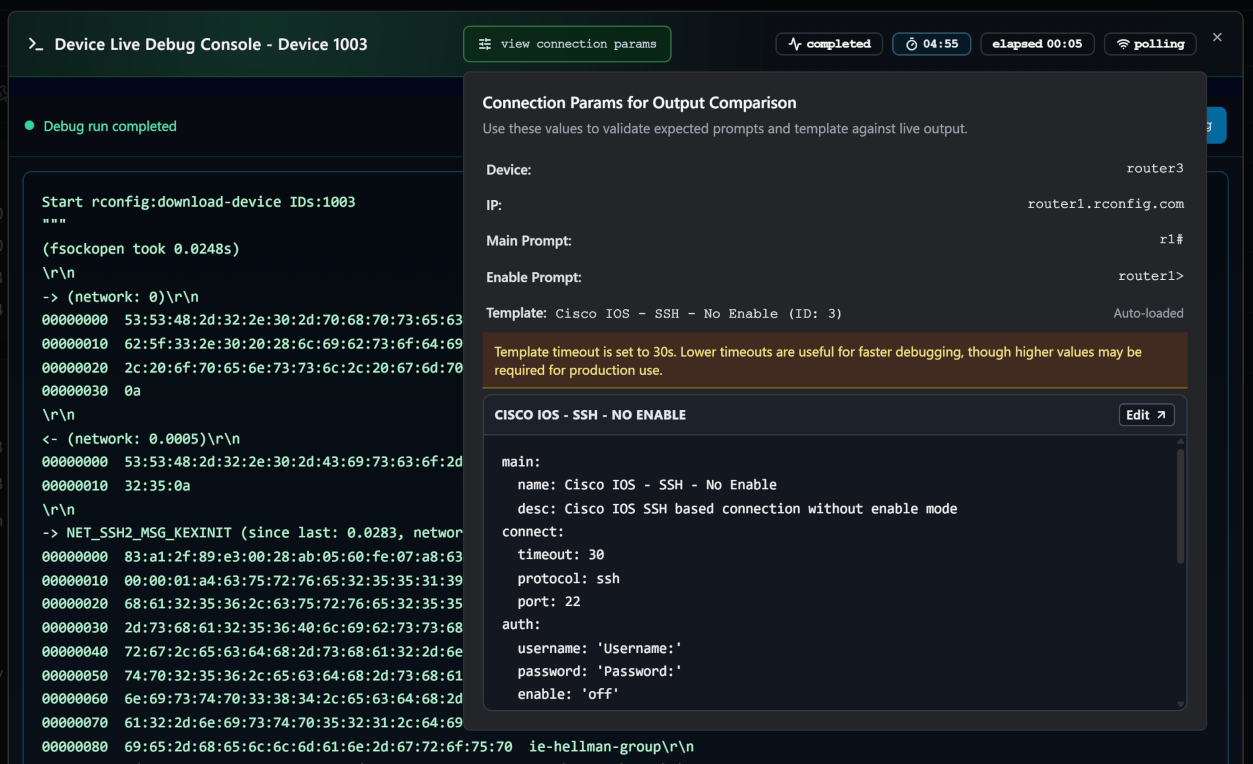
The popover surfaces:
- Device name and IP address.
- Main Prompt and Enable Prompt as configured on the device record.
- Template name and ID, with a quick Edit link that opens the template editor in a new tab.
- A formatted preview of the template YAML for the assigned template, including a warning banner when the template’s
connect.timeoutis set above 10 seconds (a common source of slow backups during diagnosis).
This card removes the back-and-forth of opening the device edit screen in another tab to verify prompts or template settings against the live output.
4. Live Output Terminal
Section titled “4. Live Output Terminal”The main panel is a green-on-black, monospace terminal that renders the streamed debug output line by line. While streaming, a blinking cursor indicates the run is still active. If the underlying capture buffer was clipped to keep the UI responsive, an “Output was truncated to keep the session responsive” note appears beneath the terminal. The full output remains available via the CLI command.
5. Analysis & Recommendations
Section titled “5. Analysis & Recommendations”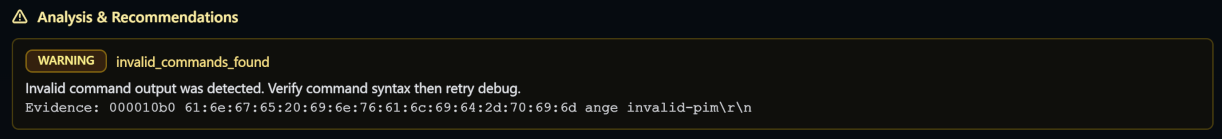
After the run finishes, rConfig parses the output server-side and emits a list of findings into the Analysis & Recommendations panel:
- Each finding is tagged with a severity (
info,warning,danger). - Each finding includes the matched rule, a message describing the suspected problem, and where applicable an evidence snippet quoting the exact output line that triggered the rule.
- A clean run with no findings shows “Completed successfully. No recommendations needed.” in green.
- Hard errors (run failed to start, transport error) appear in a red error band at the top of the panel.
Streaming Mechanics
Section titled “Streaming Mechanics”The console prefers Server-Sent Events (SSE). On dialog open it probes /api/device/debug-runs/{id}/stream and only switches to SSE if the server confirms a text/event-stream response. If SSE is unavailable, blocked by an intermediary, or the connection drops, the console transparently falls back to 2-second HTTP polling of the run’s REST endpoint until the run reaches a terminal state. The active mode is always reflected in the stream mode badge.
The 5-minute UI Wait Limit
Section titled “The 5-minute UI Wait Limit”Browser sessions are capped at 5 minutes to keep tabs responsive and prevent runaway connections. If a run hasn’t completed by then, the console:
- Sets the run state to
timed_outin the UI (the server-side run continues until the worker finishes; only the in-browser session has stopped). - Surfaces a red banner advising you to copy the debug command and continue the diagnosis from the CLI, where there is no such limit.
- Shows the same advice when you hover the Max wait warning badge once 4 minutes have elapsed.
Re-attaching to an In-progress Run
Section titled “Re-attaching to an In-progress Run”Only one debug run per device can be active at a time. If a second user (or a second tab) presses Run Live Debug while a run is already in progress, the server replies with a 409 Conflict carrying the existing run record, and the console attaches to that run, replays any output already captured, and continues to stream from the latest offset.
Live Debug Console vs. the CLI Approach
Section titled “Live Debug Console vs. the CLI Approach”The Live Debug Console and the CLI command execute the same backup with the same debug verbosity. Only the operator experience differs.
| Aspect | Live Debug Console (UI) | CLI (php artisan rconfig:download-device <id> -d) |
|---|---|---|
| Access | Web UI; no SSH to the rConfig host | Requires shell access to the rConfig server (or its agent) |
| Output | Streams live in a terminal-style panel; auto-scrolls | Streams to stdout in the shell |
| Connection params | View Connection Params popover shows device IP, prompts, template, and YAML side-by-side with output | Operator must check the device record separately |
| Analysis | Rule-based recommendations & severity-tagged findings emitted automatically when the run finishes | Operator must read and interpret the raw output |
| Sharing | One-click Copy Contents for support tickets; Copy Debug Command to hand off to CLI | Manual tee / redirect to a file, then attach to a ticket |
| Concurrency | Auto-attaches to an in-progress run instead of starting a duplicate | No coordination; multiple operators can launch overlapping runs |
| Time limit | 5 minutes per browser session (server-side run is unaffected) | None |
| Best for | Day-to-day triage, vendor demos, screen-sharing with support, operators without shell access | Long-running captures, scripted/automated diagnostics, environments without a UI |
Benefits of the Live Debug Console
Section titled “Benefits of the Live Debug Console”- No shell access required. Network engineers and support staff can debug a backup directly from the device view.
- Faster root-cause analysis. The connection-params card and the analysis panel surface the most common misconfigurations (wrong prompt, unrealistic template timeout, authentication failures) without scrolling raw output.
- Reduced duplication. Because the dialog re-attaches to an active run, two operators investigating the same device do not start two competing backups.
- Easier hand-off. Copy Contents and Copy Debug Command are both one click: paste output into a ticket, or escalate to the CLI when a run will outlive the 5-minute UI window.
- Real-time visibility. SSE streaming with polling fallback means the operator sees what rConfig sees at the moment it sees it, instead of waiting for a download to complete and then inspecting logs.
When to Reach for the CLI Instead
Section titled “When to Reach for the CLI Instead”Use the CLI command when:
- A debug run is expected to take longer than 5 minutes (very large configurations, slow devices, deliberately raised template timeouts).
- The device is bound to a remote rConfig Agent: the Run Debug button is disabled in that case and the CLI must be used on the agent host.
- The browser session is unstable (long-distance VPN, captive portals) and reliable streaming is not possible.
- You need a permanent text artefact for archival, scripted parsing, or attaching to support tickets in bulk.
What’s next
Section titled “What’s next”- CLI Diagnostic Tools - Run the same debug backup from the shell for longer or scripted captures
- Device Prompt Troubleshooting - Diagnose prompt-matching failures surfaced in the debug output
- Authentication Verification - Rule out credential issues before deeper debugging